 9
9peptides
spectra
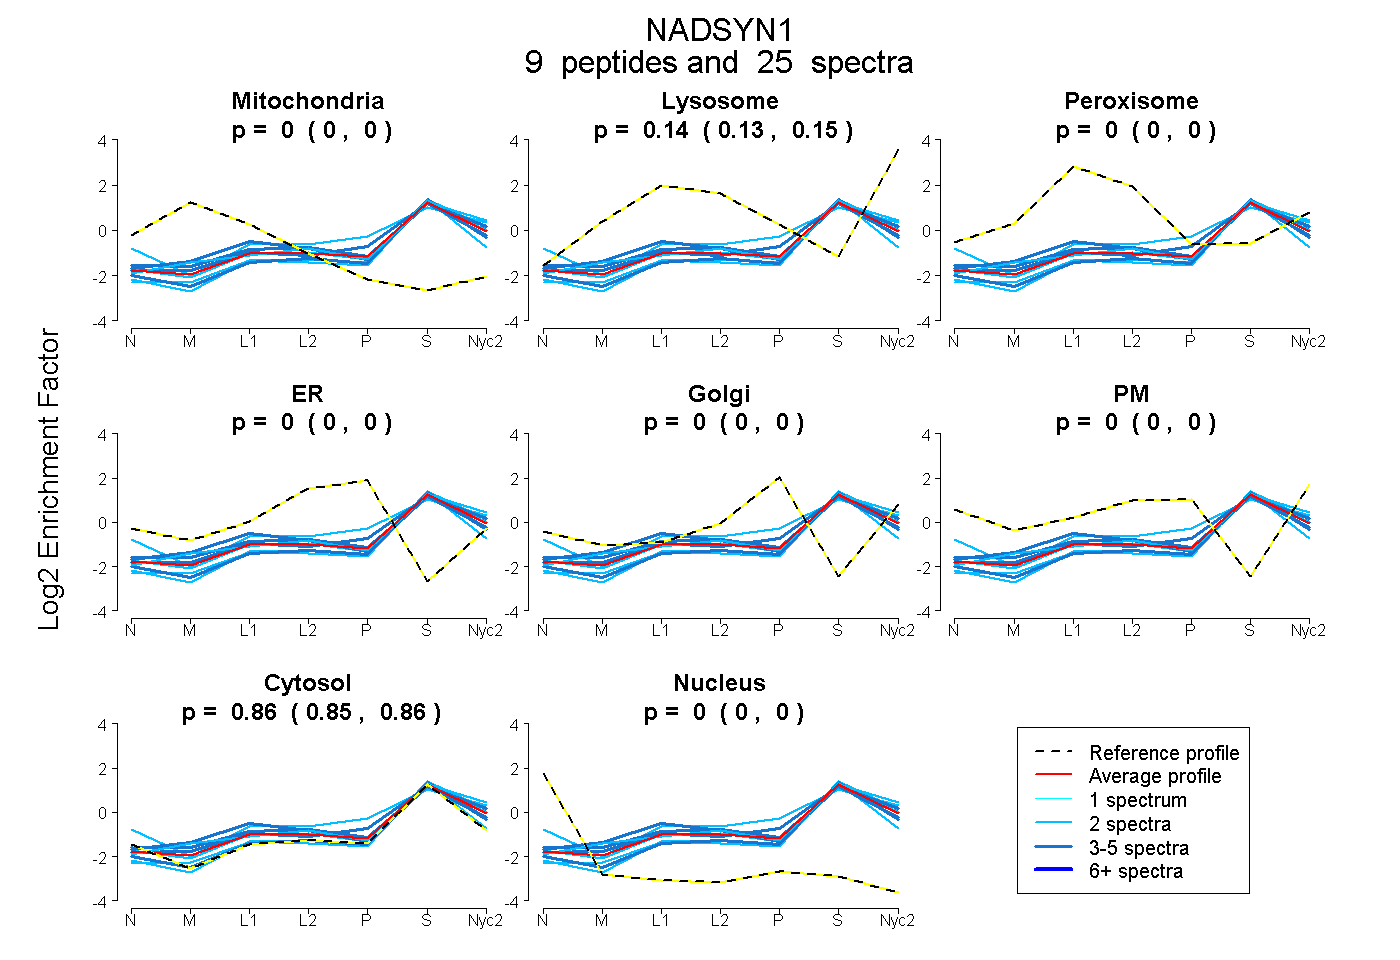
0.000 | 0.000
0.134 | 0.145
0.000 | 0.000
0.000 | 0.000
0.000 | 0.000
0.000 | 0.000
0.854 | 0.865
0.000 | 0.000
5peptides
spectra
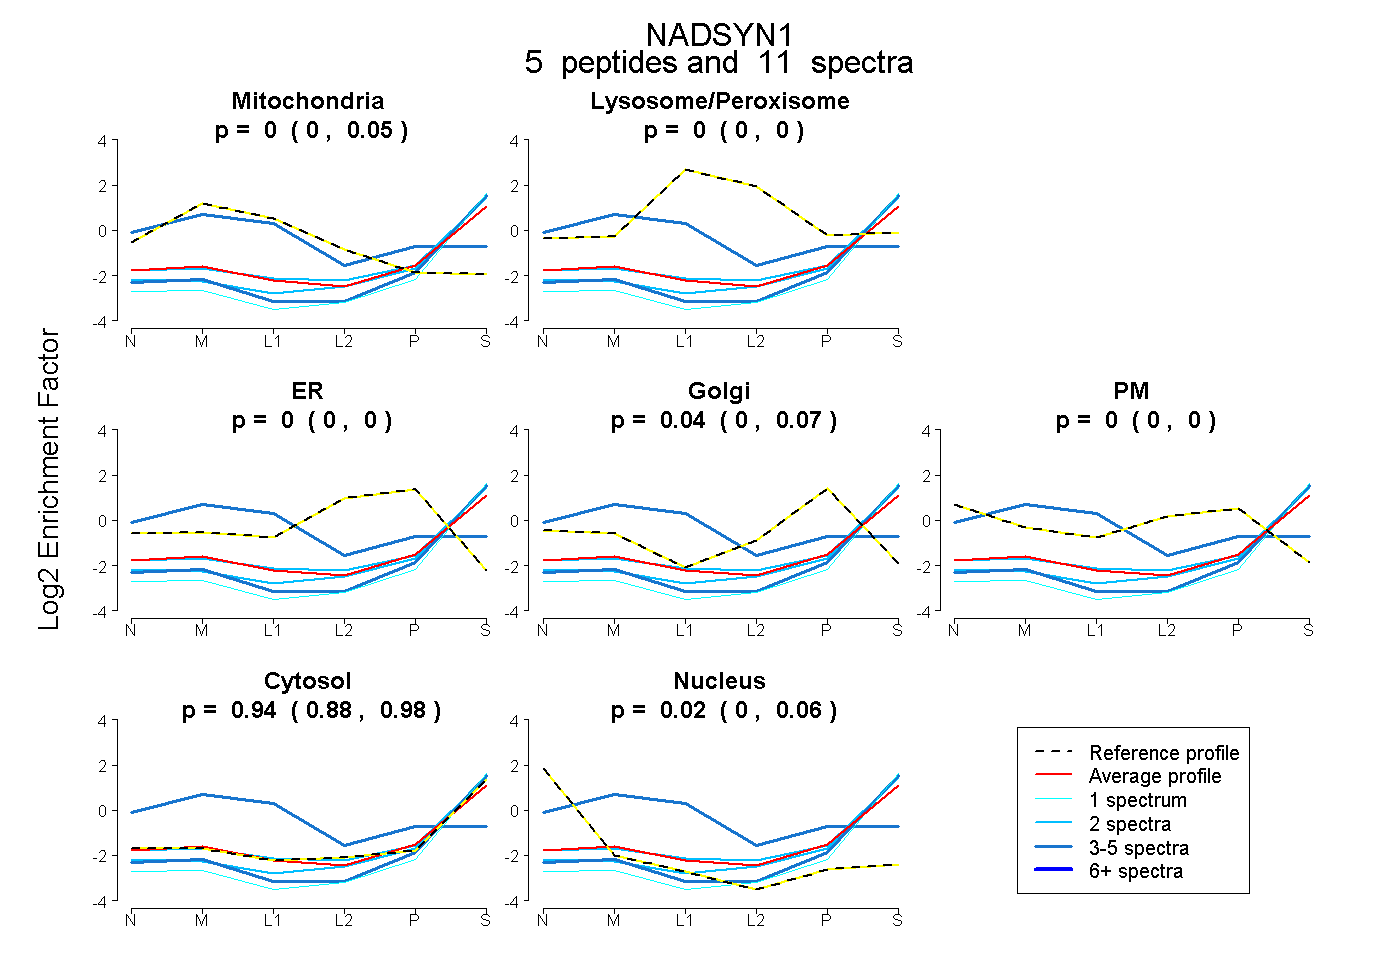
0.000 | 0.054
0.000 | 0.000
0.000 | 0.000
0.000 | 0.071
0.000 | 0.000
0.876 | 0.982
0.000 | 0.062
11peptides
spectra
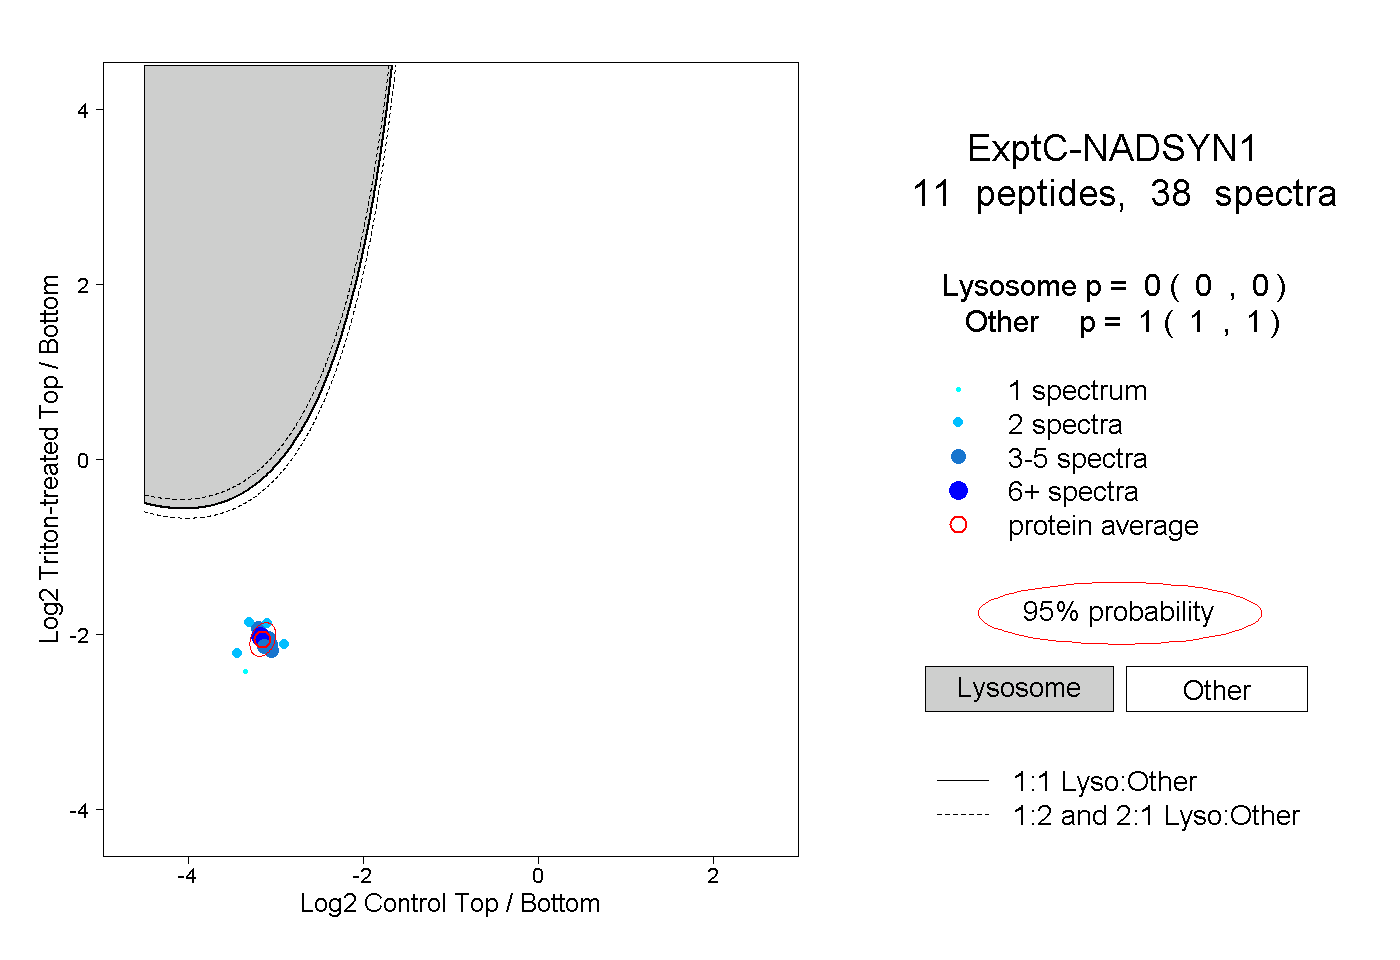
0.000 | 0.000
1.000 | 1.000