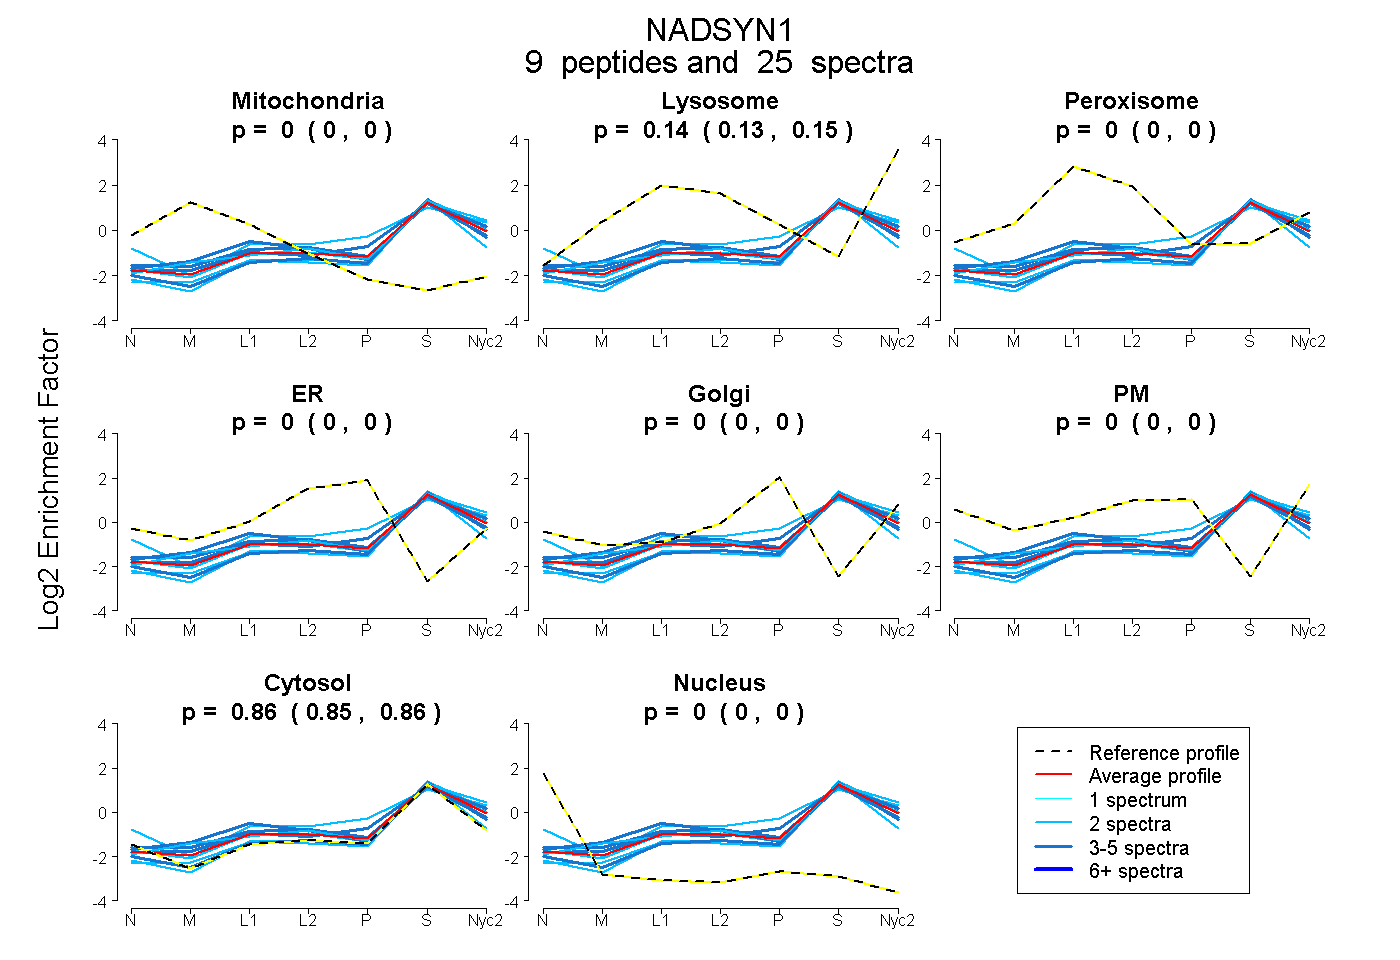
 9
9peptides
spectra
0.000 | 0.000
0.134 | 0.145
0.000 | 0.000
0.000 | 0.000
0.000 | 0.000
0.000 | 0.000
0.854 | 0.865
0.000 | 0.000
| Plot | Mito | Lyso | Perox | ER | Golgi | PM | Cytosol | Nucleus | |||||
| Expt A |
9 peptides |
25 spectra |
|
0.000 0.000 | 0.000 |
0.140 0.134 | 0.145 |
0.000 0.000 | 0.000 |
0.000 0.000 | 0.000 |
0.000 0.000 | 0.000 |
0.000 0.000 | 0.000 |
0.860 0.854 | 0.865 |
0.000 0.000 | 0.000 |
| 4 spectra, VLFLNR | 0.001 | 0.192 | 0.043 | 0.000 | 0.000 | 0.000 | 0.764 | 0.000 | ||
| 2 spectra, AGPYSMFCK | 0.000 | 0.139 | 0.000 | 0.000 | 0.013 | 0.125 | 0.723 | 0.000 | ||
| 2 spectra, FDLRPFLYNTR | 0.000 | 0.012 | 0.000 | 0.000 | 0.000 | 0.000 | 0.988 | 0.000 | ||
| 4 spectra, MALANEGNYR | 0.000 | 0.141 | 0.000 | 0.000 | 0.009 | 0.000 | 0.850 | 0.000 | ||
| 3 spectra, LLNMWK | 0.000 | 0.185 | 0.002 | 0.000 | 0.000 | 0.000 | 0.813 | 0.000 | ||
| 2 spectra, WFTPWAR | 0.000 | 0.205 | 0.000 | 0.000 | 0.000 | 0.000 | 0.795 | 0.000 | ||
| 2 spectra, ENLALQNVQAR | 0.000 | 0.067 | 0.000 | 0.000 | 0.000 | 0.000 | 0.933 | 0.000 | ||
| 4 spectra, ILLIRPK | 0.000 | 0.038 | 0.000 | 0.000 | 0.000 | 0.000 | 0.962 | 0.000 | ||
| 2 spectra, QTEEYVLPR | 0.000 | 0.131 | 0.000 | 0.000 | 0.000 | 0.000 | 0.869 | 0.000 |
| Plot | Mito | Lyso or Perox | ER | Golgi | PM | Cytosol | Nucleus | ||||||
| Expt B |
5 peptides |
11 spectra |
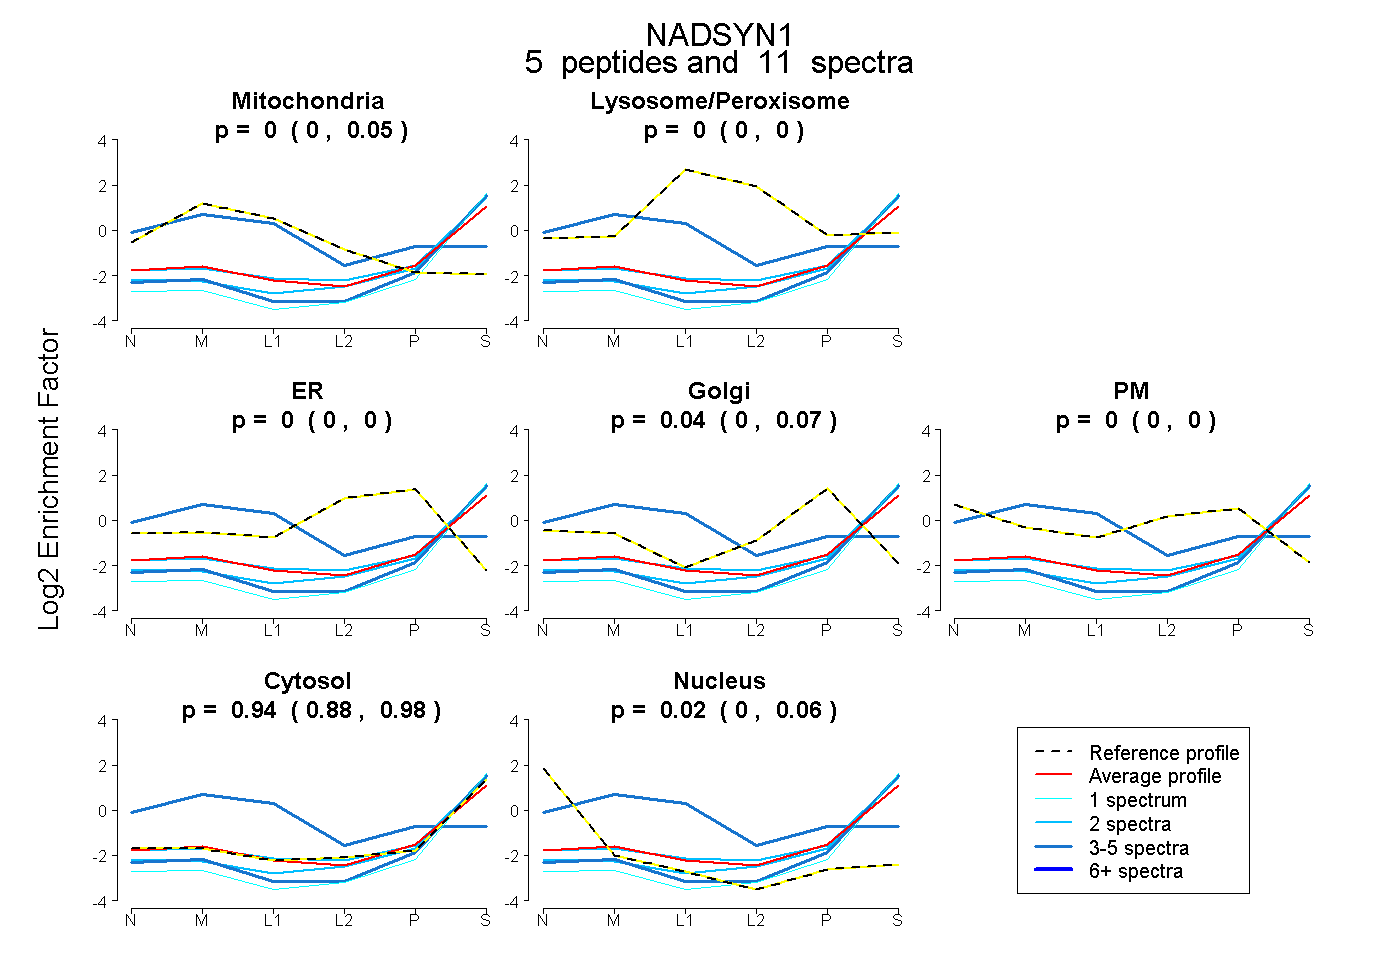 |
0.000 0.000 | 0.054 |
0.000 0.000 | 0.000 |
0.000 0.000 | 0.000 |
0.040 0.000 | 0.071 |
0.000 0.000 | 0.000 |
0.939 0.876 | 0.982 |
0.021 0.000 | 0.062 |
|||
| Plot | Lyso | Other | |||||||||||
| Expt C |
11 peptides |
38 spectra |
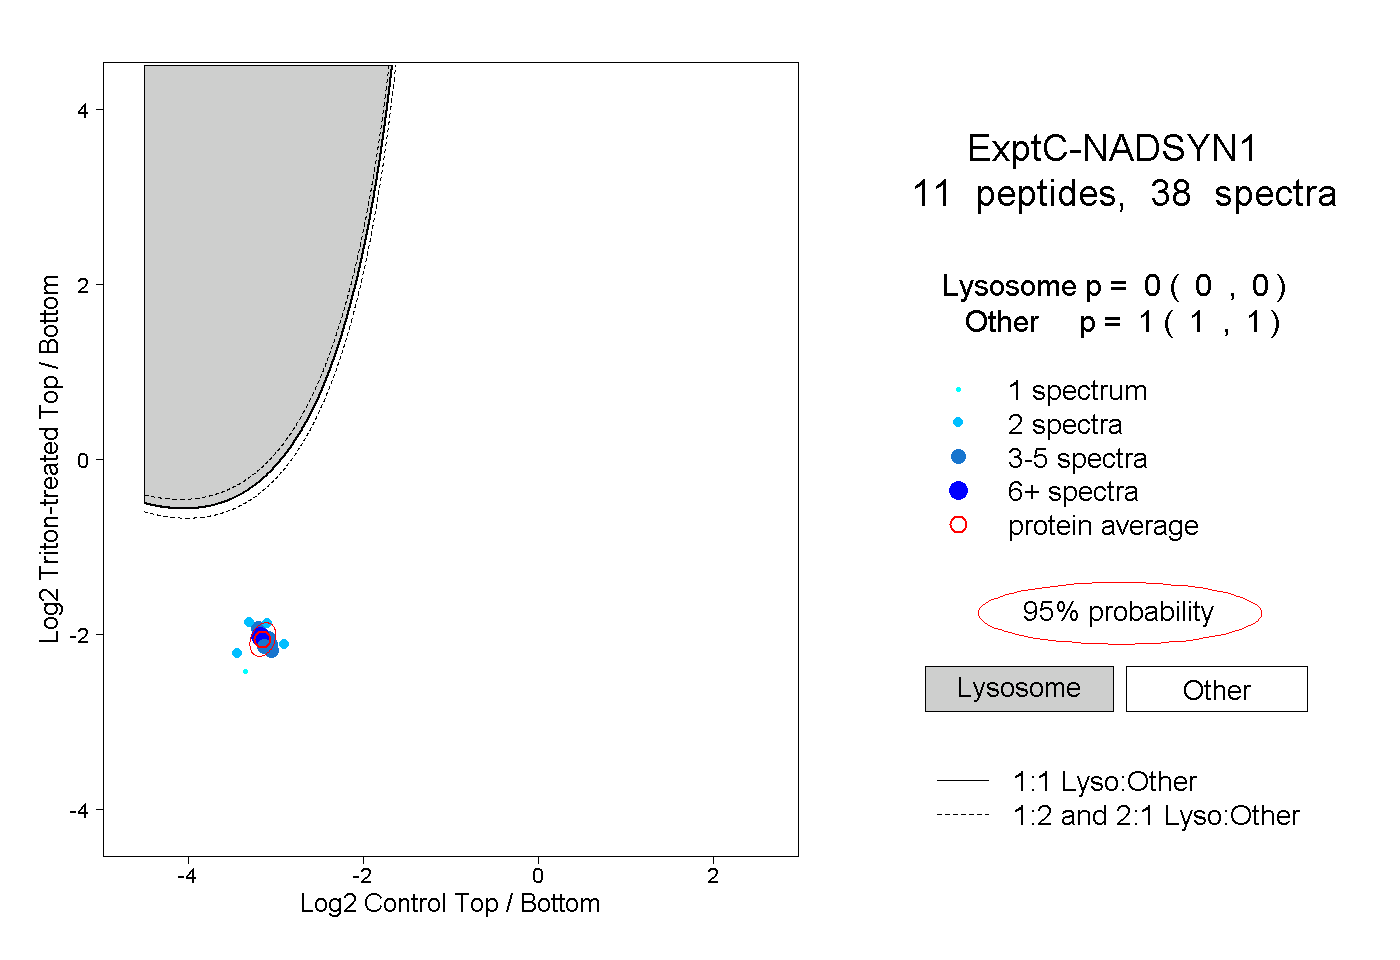 |
0.000 0.000 | 0.000 |
1.000 1.000 | 1.000 |