 7
7peptides
spectra
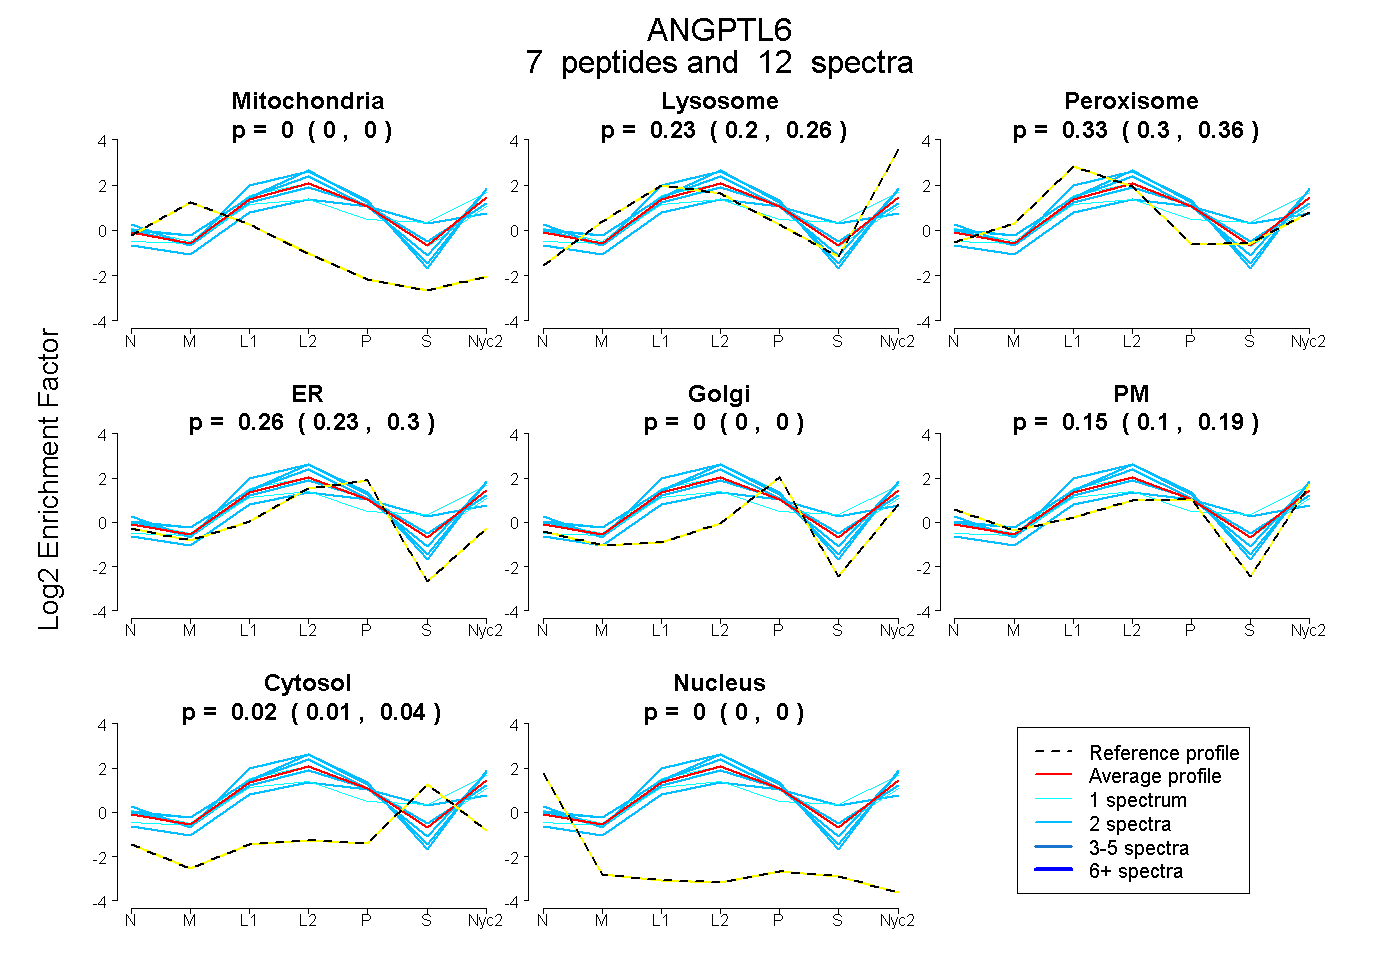
0.000 | 0.000
0.198 | 0.257
0.302 | 0.360
0.226 | 0.296
0.000 | 0.000
0.098 | 0.188
0.006 | 0.041
0.000 | 0.000
7peptides
spectra
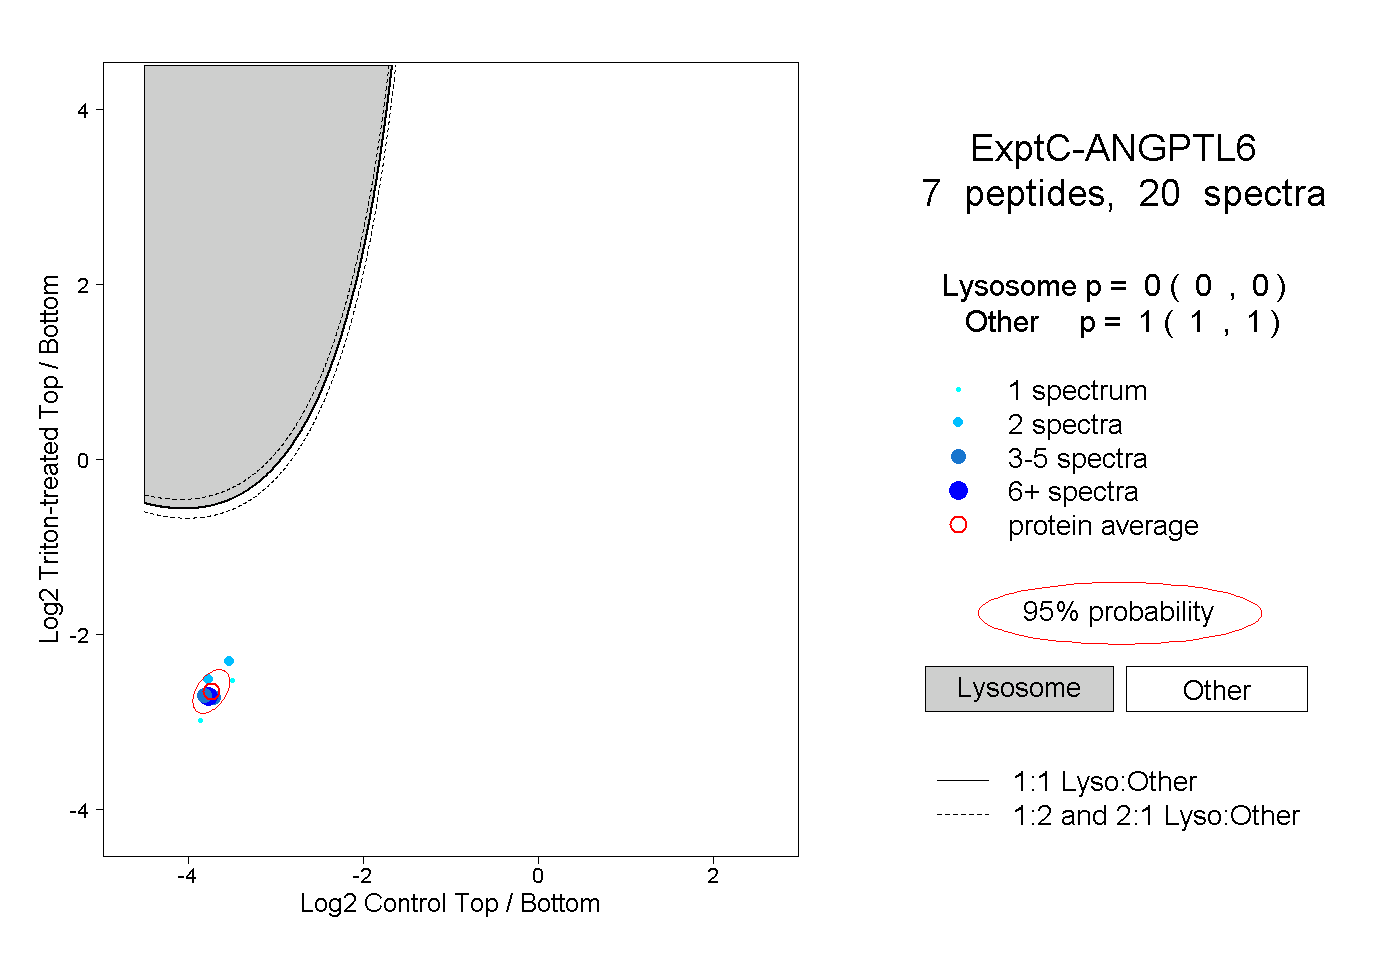
0.000 | 0.000
1.000 | 1.000
2peptides
spectra
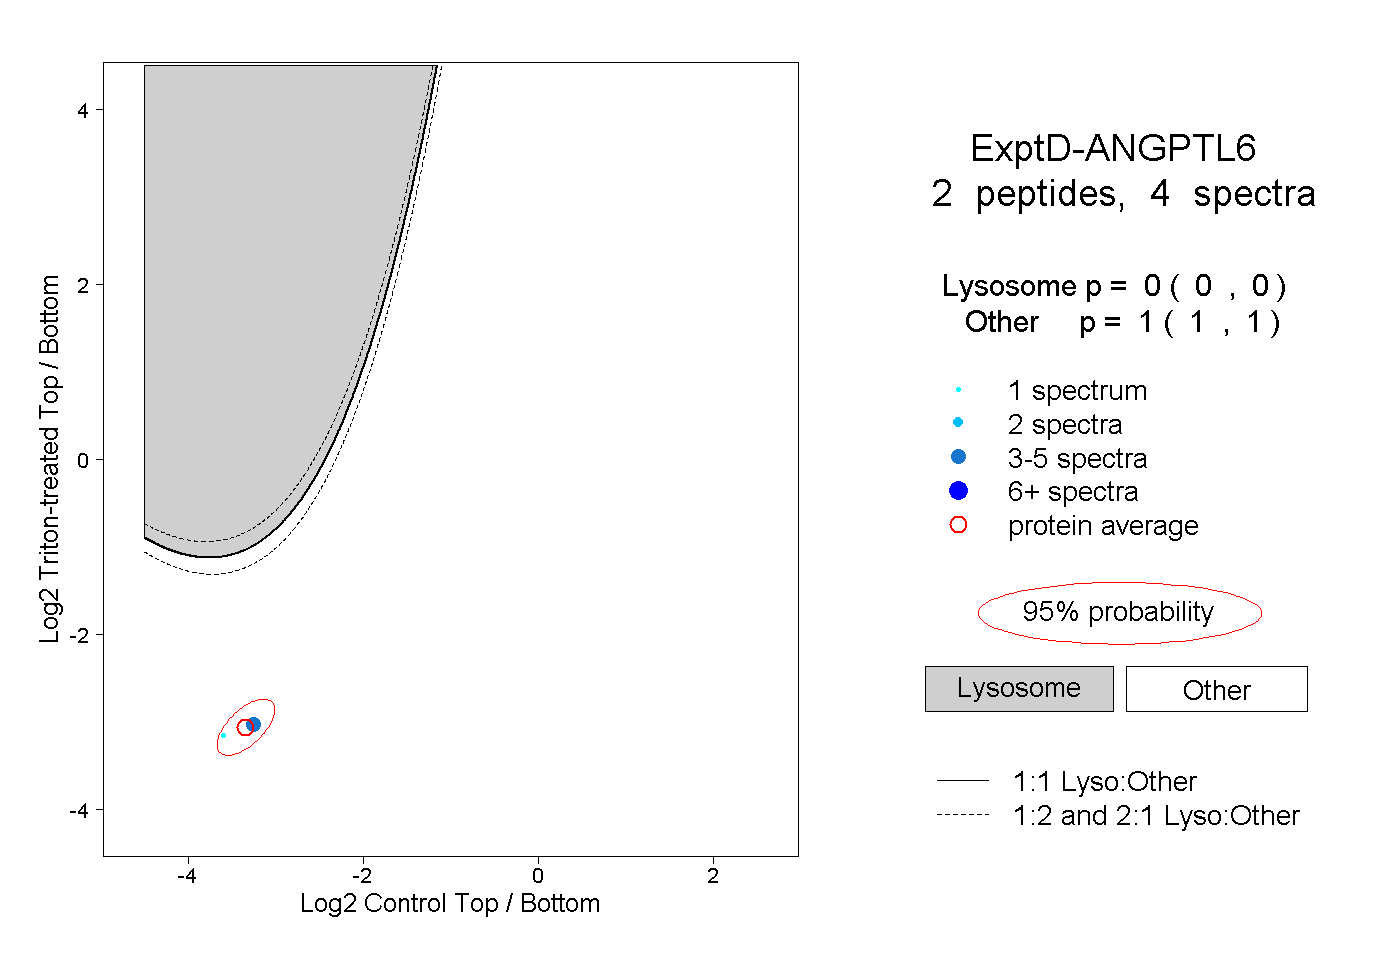
0.000 | 0.000
1.000 | 1.000