 7
7peptides
spectra
0.000 | 0.000
0.198 | 0.257
0.302 | 0.360
0.226 | 0.296
0.000 | 0.000
0.098 | 0.188
0.006 | 0.041
0.000 | 0.000
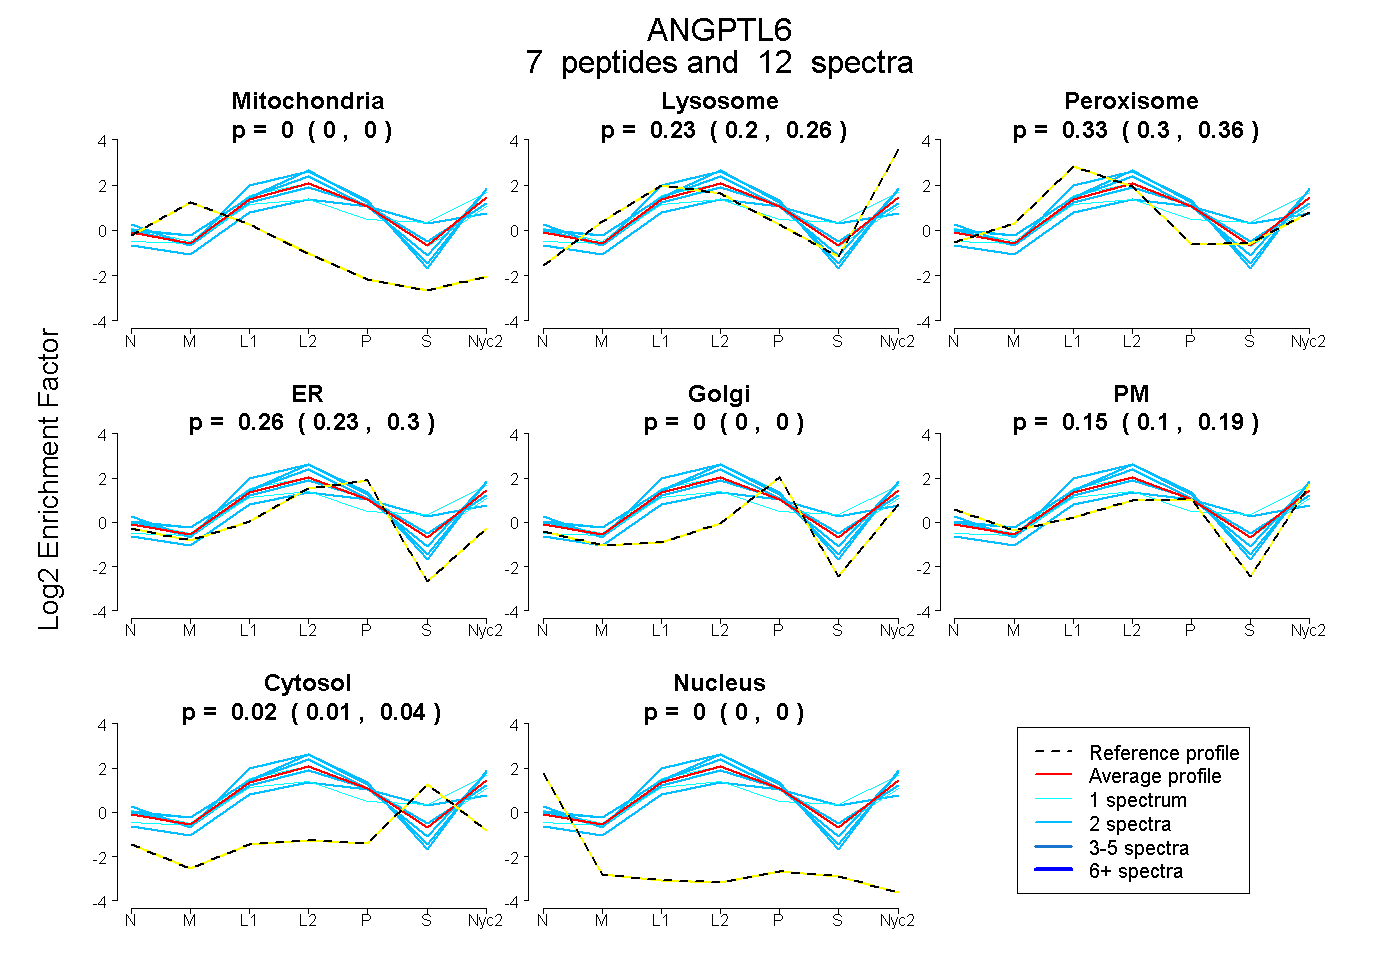
| Plot | Mito | Lyso | Perox | ER | Golgi | PM | Cytosol | Nucleus | |||||
| Expt A |
7 peptides |
12 spectra |
|
0.000 0.000 | 0.000 |
0.229 0.198 | 0.257 |
0.333 0.302 | 0.360 |
0.263 0.226 | 0.296 |
0.000 0.000 | 0.000 |
0.151 0.098 | 0.188 |
0.025 0.006 | 0.041 |
0.000 0.000 | 0.000 |
| 2 spectra, HEELLR | 0.000 | 0.270 | 0.292 | 0.184 | 0.000 | 0.254 | 0.000 | 0.000 | ||
| 1 spectrum, ACASPER | 0.000 | 0.092 | 0.460 | 0.289 | 0.000 | 0.156 | 0.002 | 0.000 | ||
| 2 spectra, ALGAEAEAR | 0.000 | 0.144 | 0.356 | 0.252 | 0.000 | 0.184 | 0.064 | 0.000 | ||
| 2 spectra, LQQLEEQLR | 0.000 | 0.326 | 0.210 | 0.298 | 0.000 | 0.166 | 0.000 | 0.000 | ||
| 1 spectrum, GGAYSLK | 0.000 | 0.354 | 0.287 | 0.014 | 0.000 | 0.118 | 0.228 | 0.000 | ||
| 2 spectra, AAMLTR | 0.000 | 0.218 | 0.234 | 0.285 | 0.000 | 0.000 | 0.264 | 0.000 | ||
| 2 spectra, SSEASQDSELATLR | 0.000 | 0.266 | 0.261 | 0.237 | 0.000 | 0.236 | 0.000 | 0.000 |
| Plot | Lyso | Other | |||||||||||
| Expt C |
7 peptides |
20 spectra |
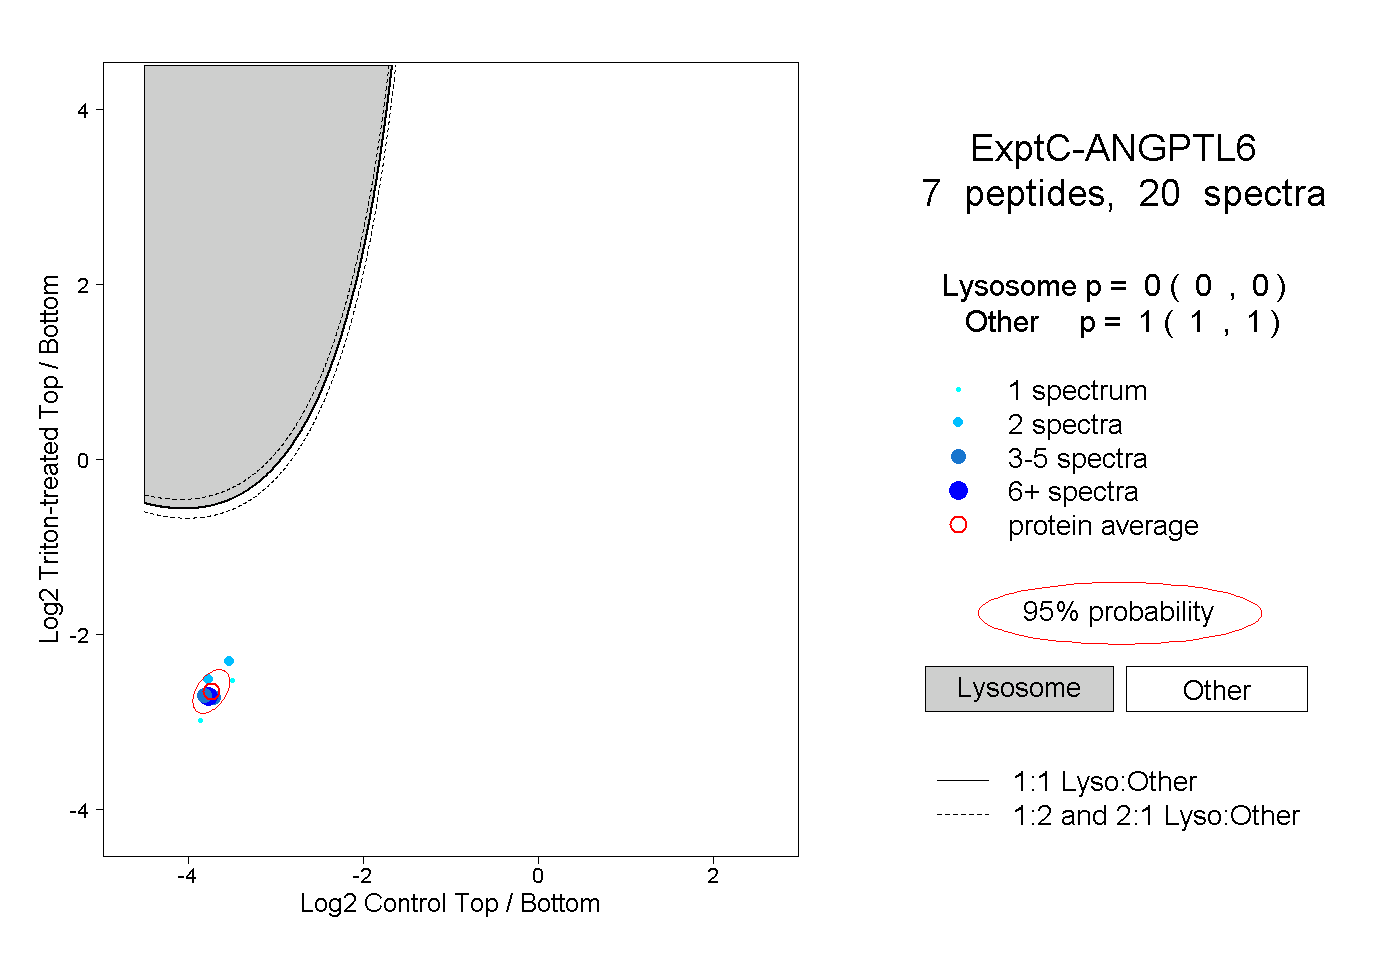 |
0.000 0.000 | 0.000 |
1.000 1.000 | 1.000 |
||||||||
| Plot | Lyso | Other | |||||||||||
| Expt D |
2 peptides |
4 spectra |
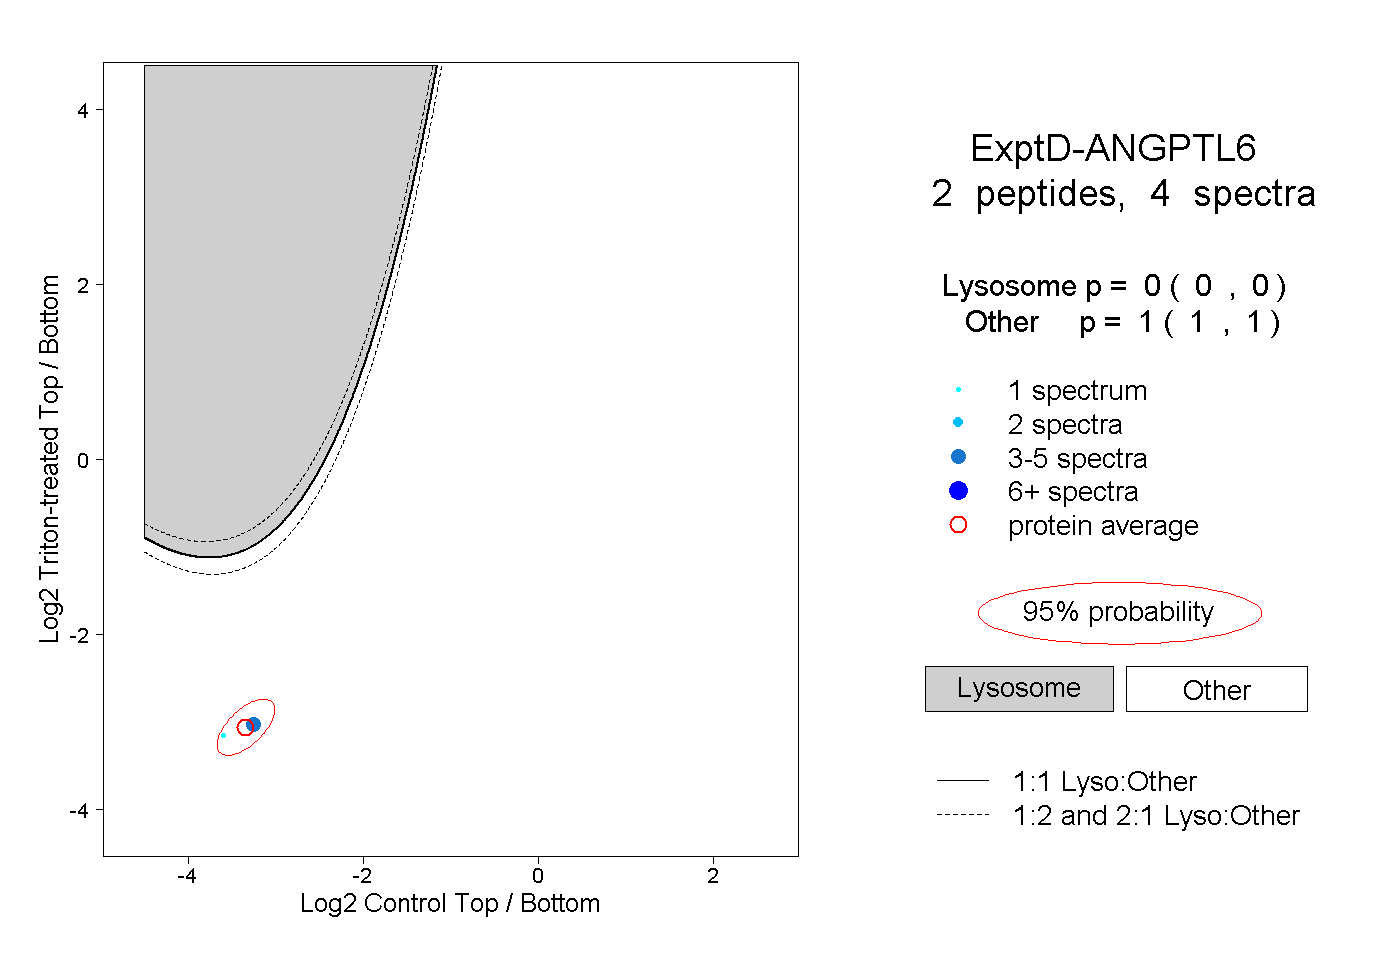 |
0.000 0.000 | 0.000 |
1.000 1.000 | 1.000 |