 6
6peptides
spectra
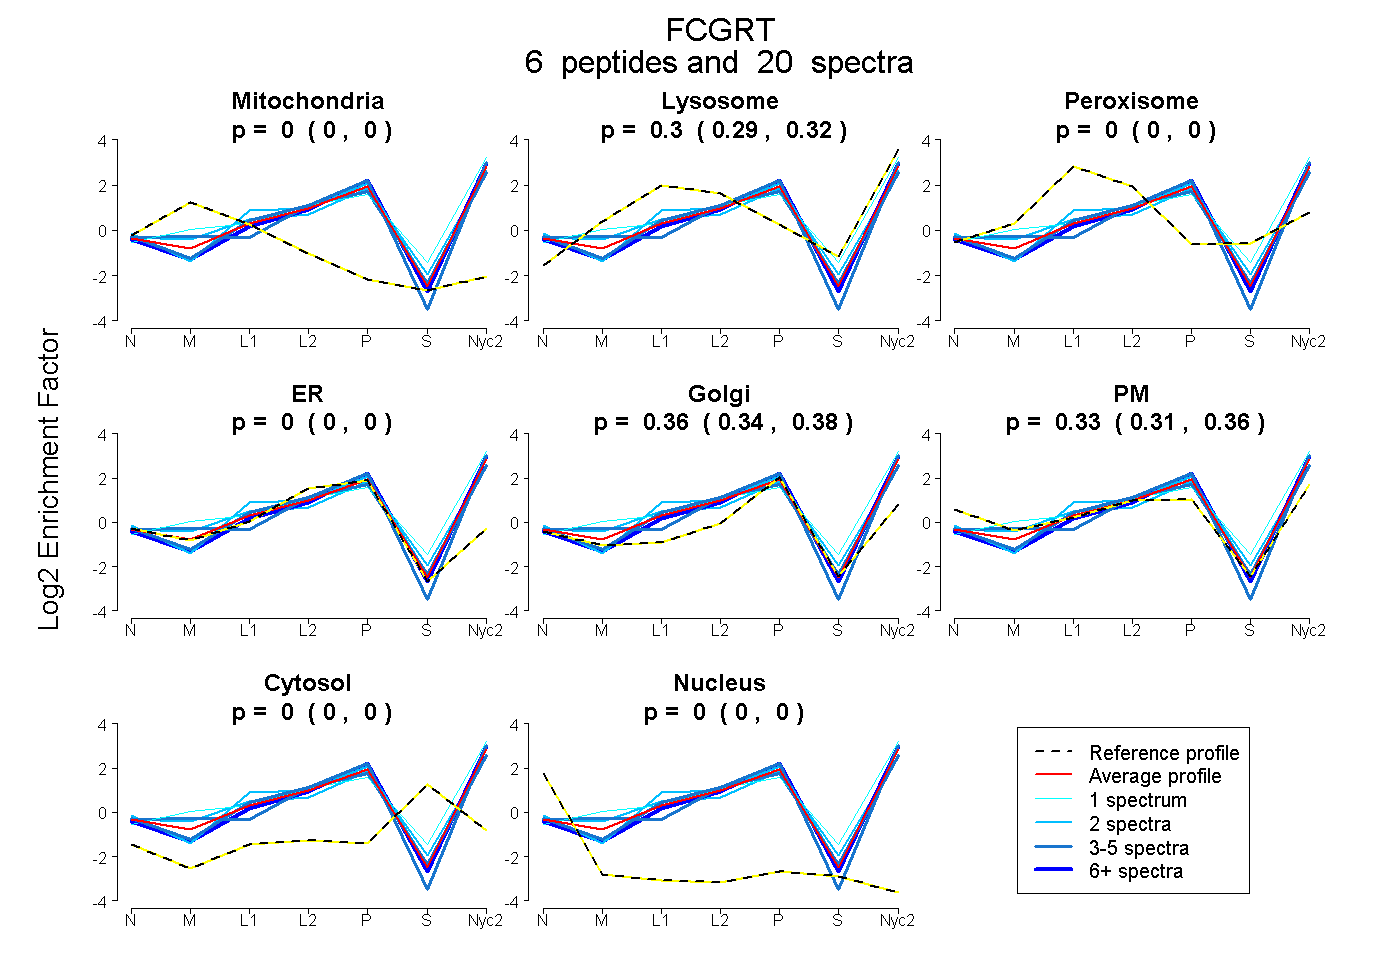
0.000 | 0.000
0.287 | 0.318
0.000 | 0.000
0.000 | 0.000
0.340 | 0.380
0.305 | 0.360
0.000 | 0.000
0.000 | 0.000
3peptides
spectra
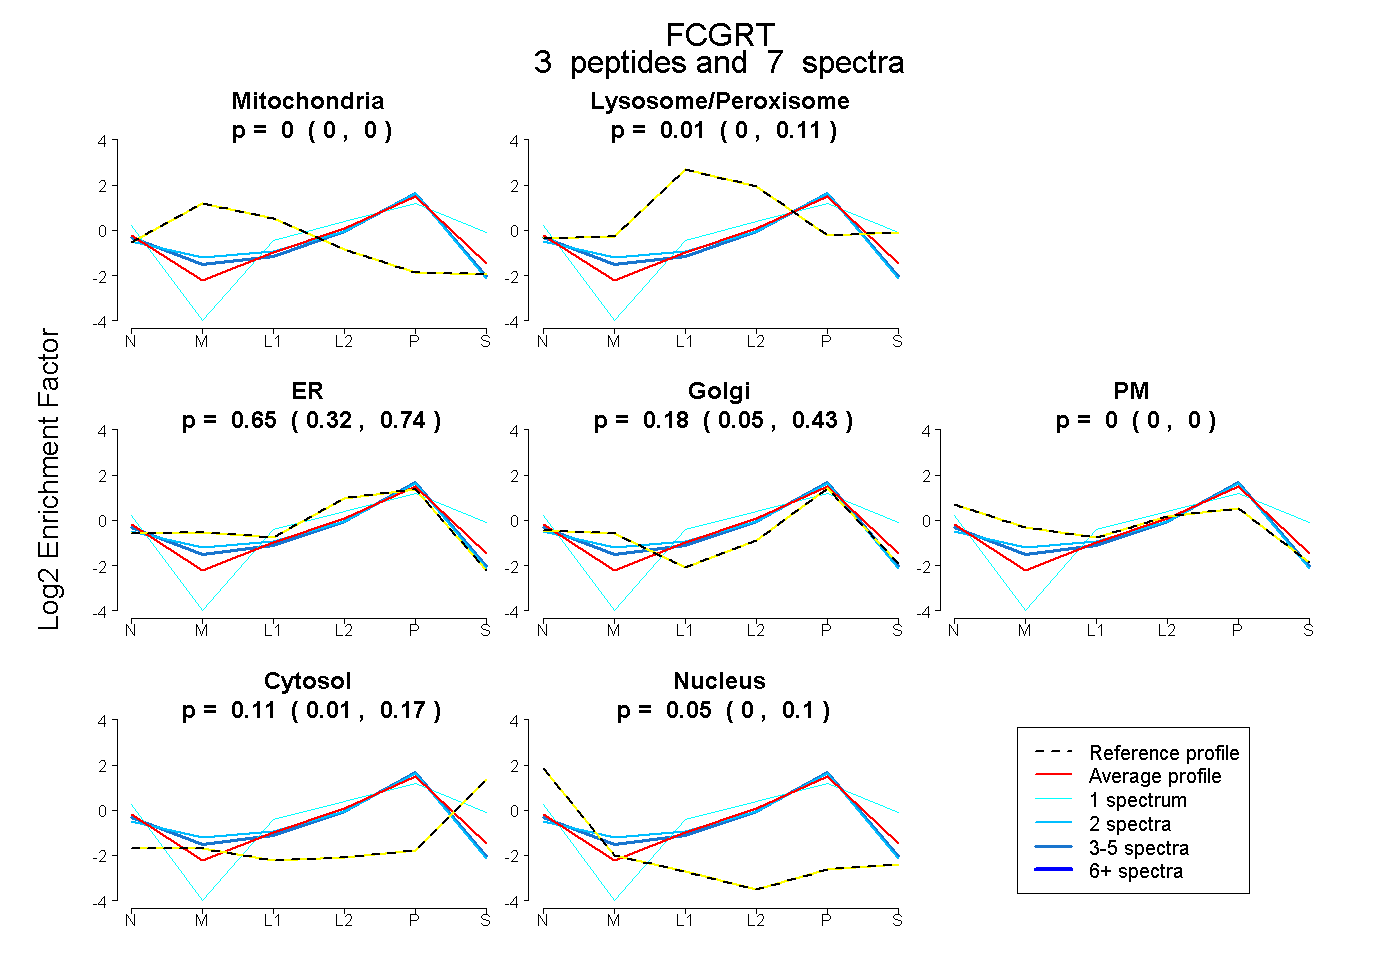
0.000 | 0.000
0.000 | 0.110
0.317 | 0.739
0.046 | 0.432
0.000 | 0.000
0.010 | 0.170
0.000 | 0.098
5peptides
spectra

0.000 | 0.000
1.000 | 1.000
3peptides
spectra
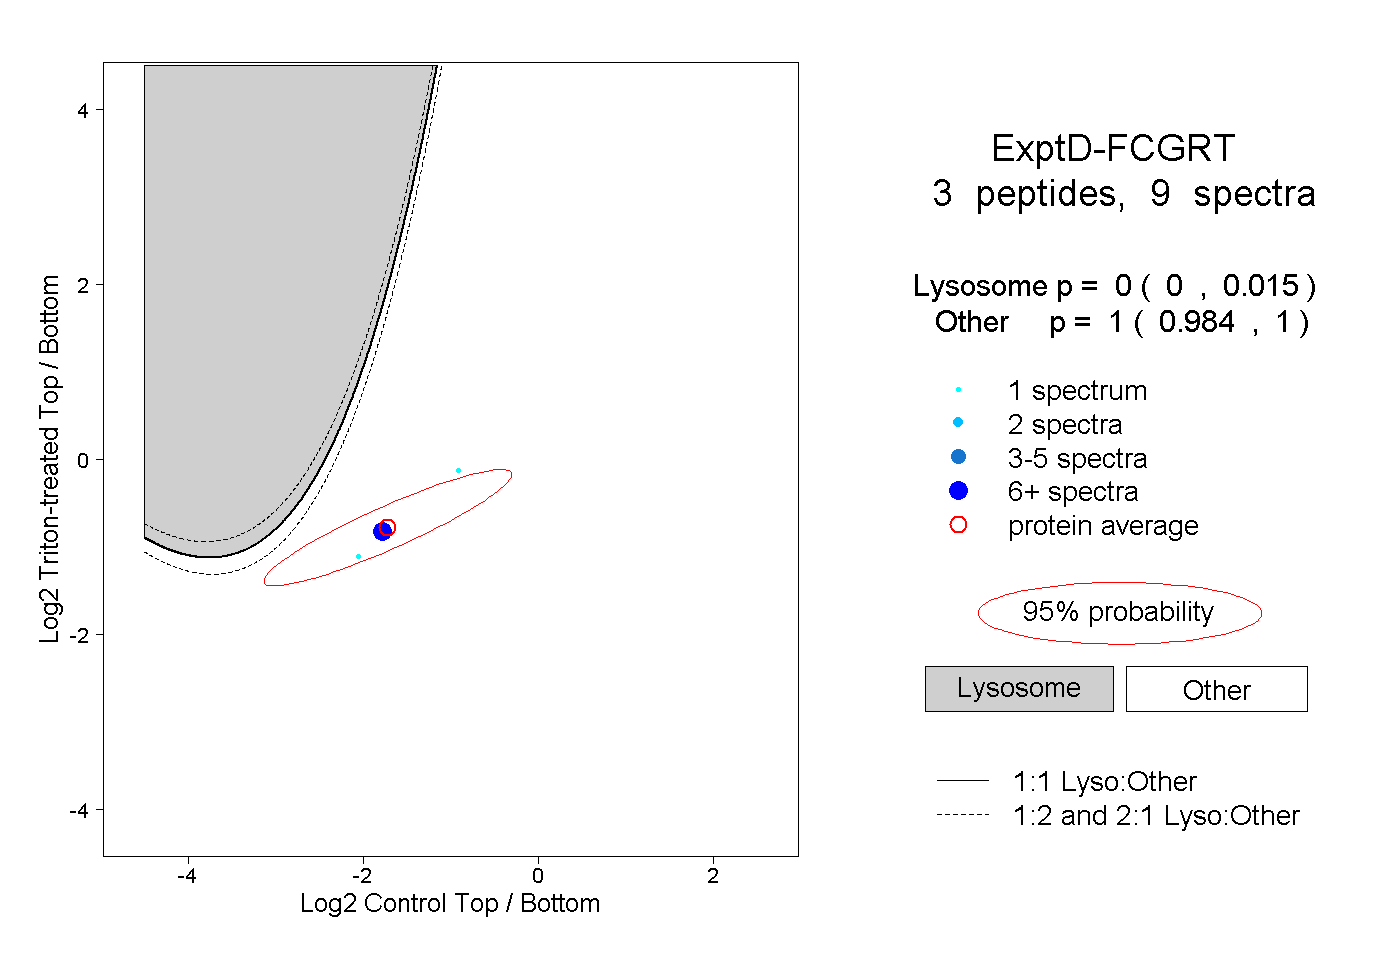
0.000 | 0.015
0.984 | 1.000