FCGRT
[ENSRNOP00000027944]
Main page
| | | Plot |
Mito |
Lyso |
|
Perox |
ER |
Golgi |
PM |
Cytosol |
Nucleus |
|
| Expt A |
 6
6
peptides |
20
spectra |
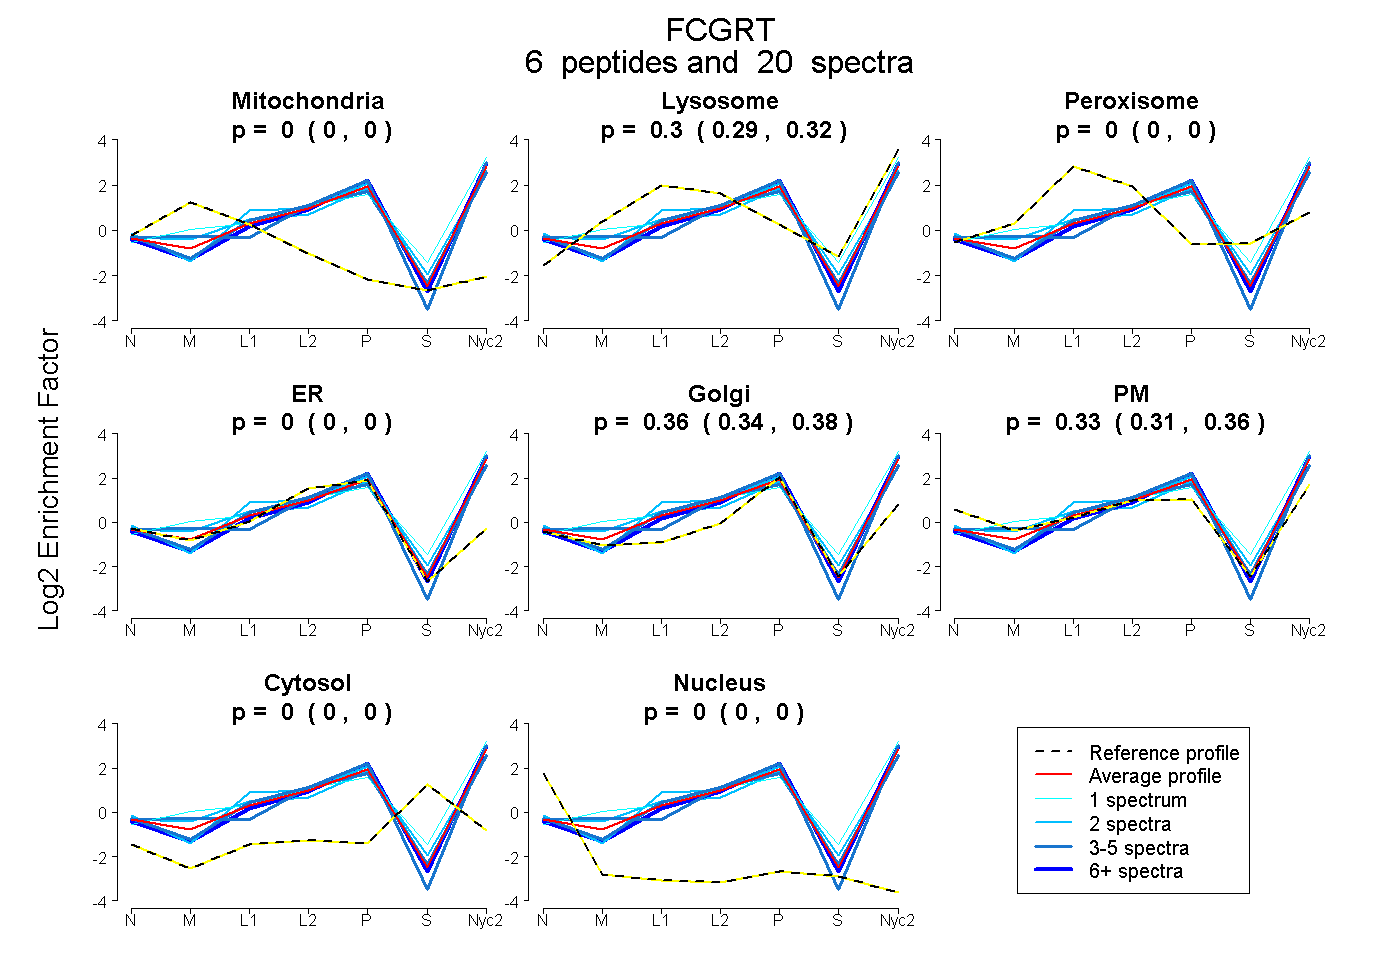 |
0.000
0.000 | 0.000 |
0.305
0.287 | 0.318 |
|
0.000
0.000 | 0.000 |
0.000
0.000 | 0.000 |
0.362
0.340 | 0.380 |
0.334
0.305 | 0.360 |
0.000
0.000 | 0.000 |
0.000
0.000 | 0.000 |
|
| | | Plot |
Mito |
|
Lyso or Perox |
|
ER |
Golgi |
PM |
Cytosol |
Nucleus |
|
| Expt B |
3
peptides |
7
spectra |
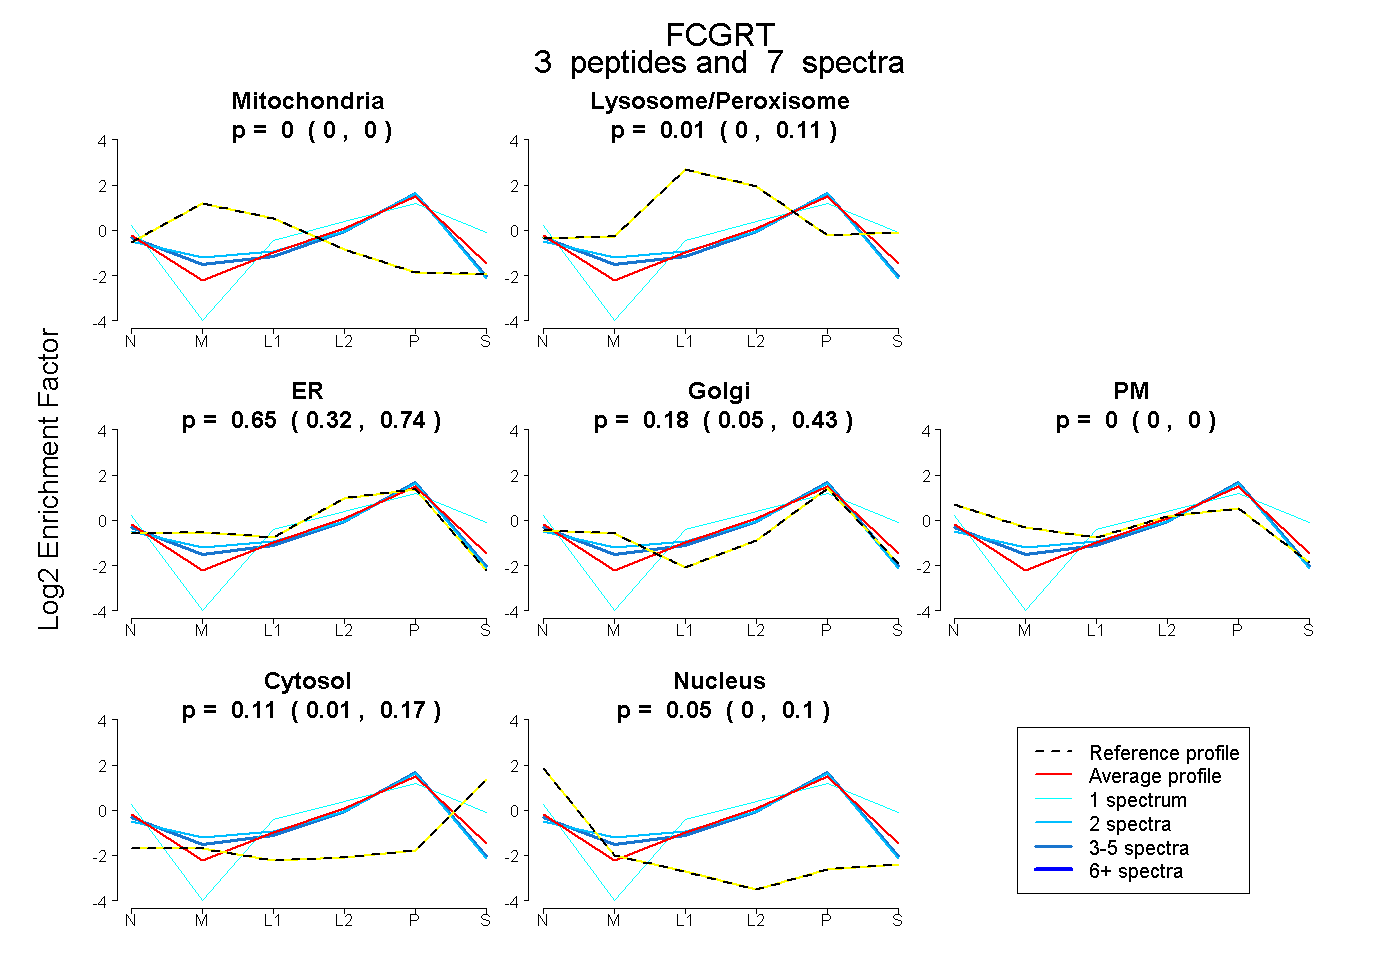 |
0.000
0.000 | 0.000 |
|
0.013
0.000 | 0.110 |
|
0.652
0.317 | 0.739 |
0.182
0.046 | 0.432 |
0.000
0.000 | 0.000 |
0.106
0.010 | 0.170 |
0.046
0.000 | 0.098 |
|
| 2 spectra, LLGHLER |
0.000 |
|
0.022 |
|
0.545 |
0.425 |
0.000 |
0.000 |
0.008 |
|
| 1 spectrum, ESEFLLTSCPER |
0.000 |
|
0.190 |
|
0.477 |
0.000 |
0.000 |
0.278 |
0.055 |
|
| 4 spectra, EQLFLEAIR |
0.000 |
|
0.000 |
|
0.551 |
0.413 |
0.000 |
0.000 |
0.036 |
|
| | | Plot |
|
Lyso |
|
|
|
|
|
|
|
Other |
| Expt C |
5
peptides |
25
spectra |
 |
|
0.000
0.000 | 0.000 |
|
|
|
|
|
|
|
1.000
1.000 | 1.000 |
| | | Plot |
|
Lyso |
|
|
|
|
|
|
|
Other |
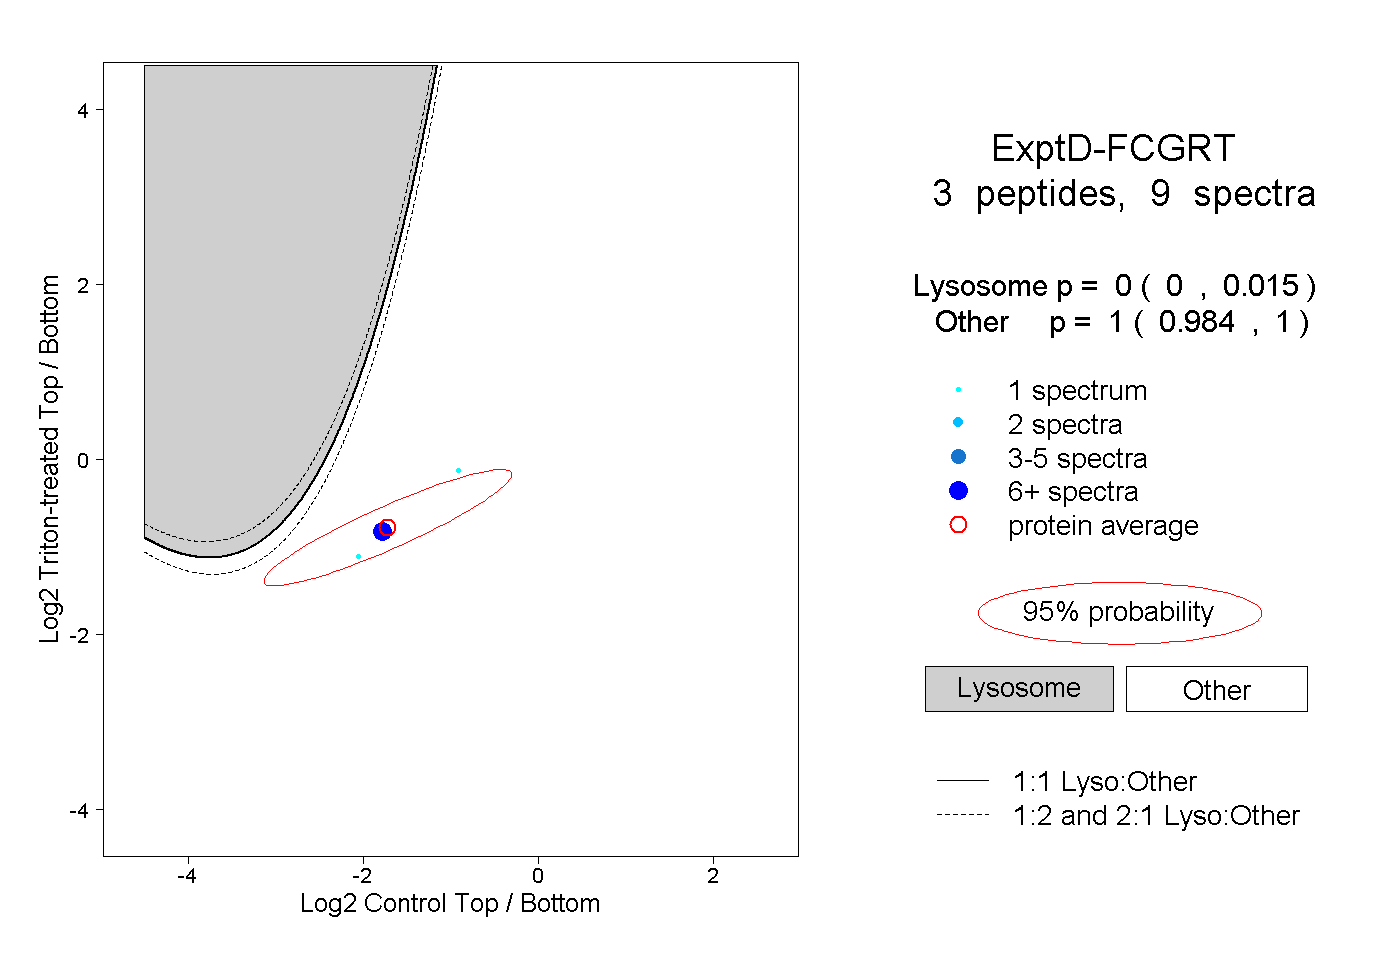
| Expt D |
3
peptides |
9
spectra |
 |
|
0.000
0.000 | 0.015 |
|
|
|
|
|
|
|
1.000
0.984 | 1.000 |