 14
14peptides
spectra

0.000 | 0.000
0.000 | 0.000
0.000 | 0.000
0.000 | 0.000
0.000 | 0.000
0.000 | 0.000
0.972 | 0.981
0.018 | 0.027
7peptides
spectra

0.000 | 0.000
0.000 | 0.000
0.000 | 0.000
0.029 | 0.052
0.000 | 0.000
0.947 | 0.964
0.000 | 0.009
12peptides
spectra
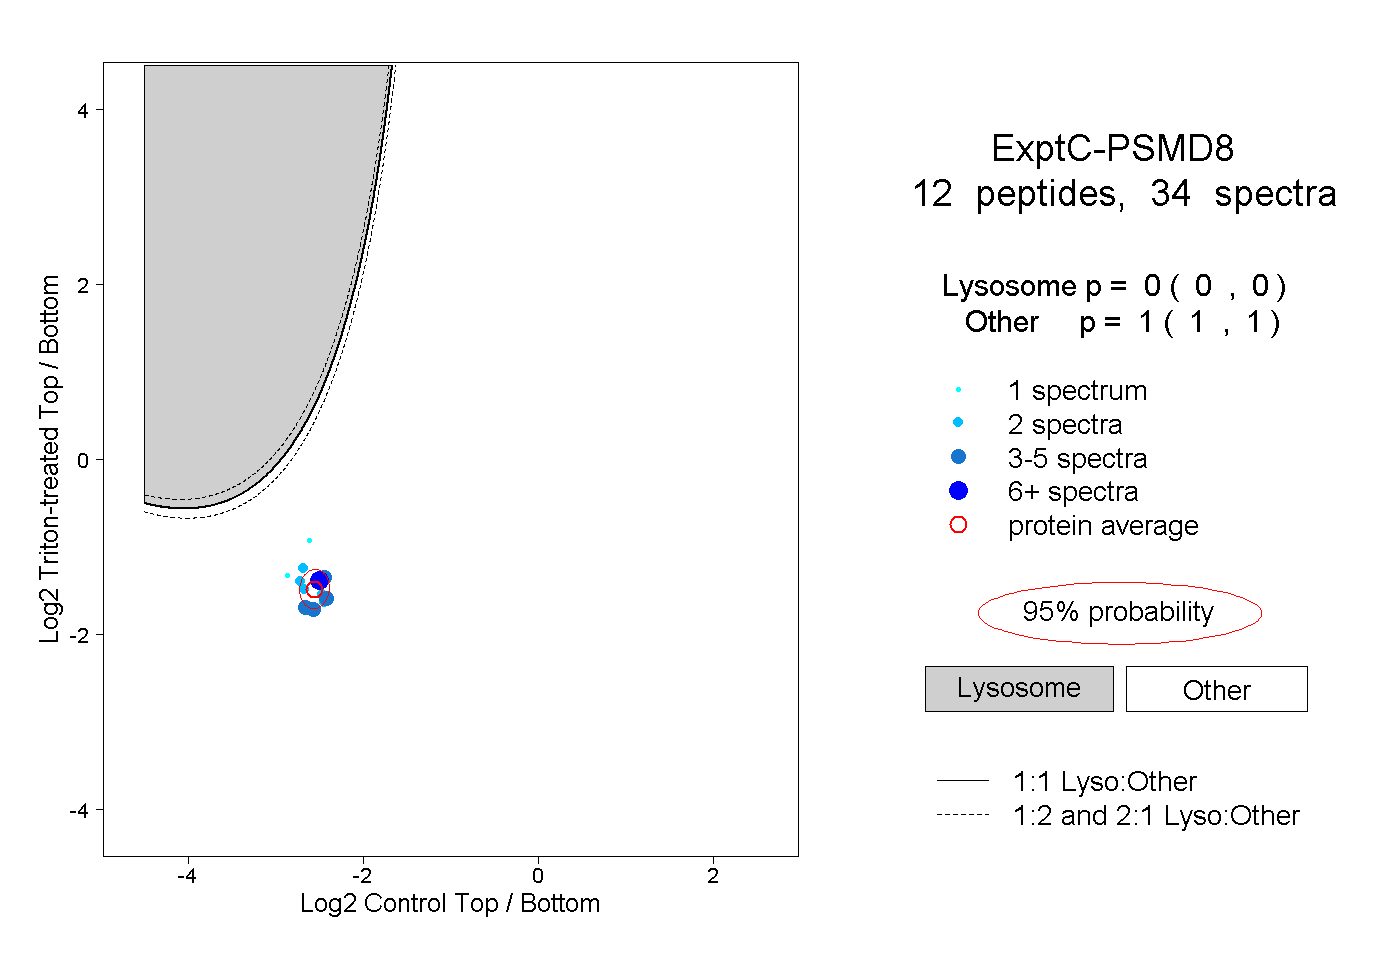
0.000 | 0.000
1.000 | 1.000
2peptides
spectra
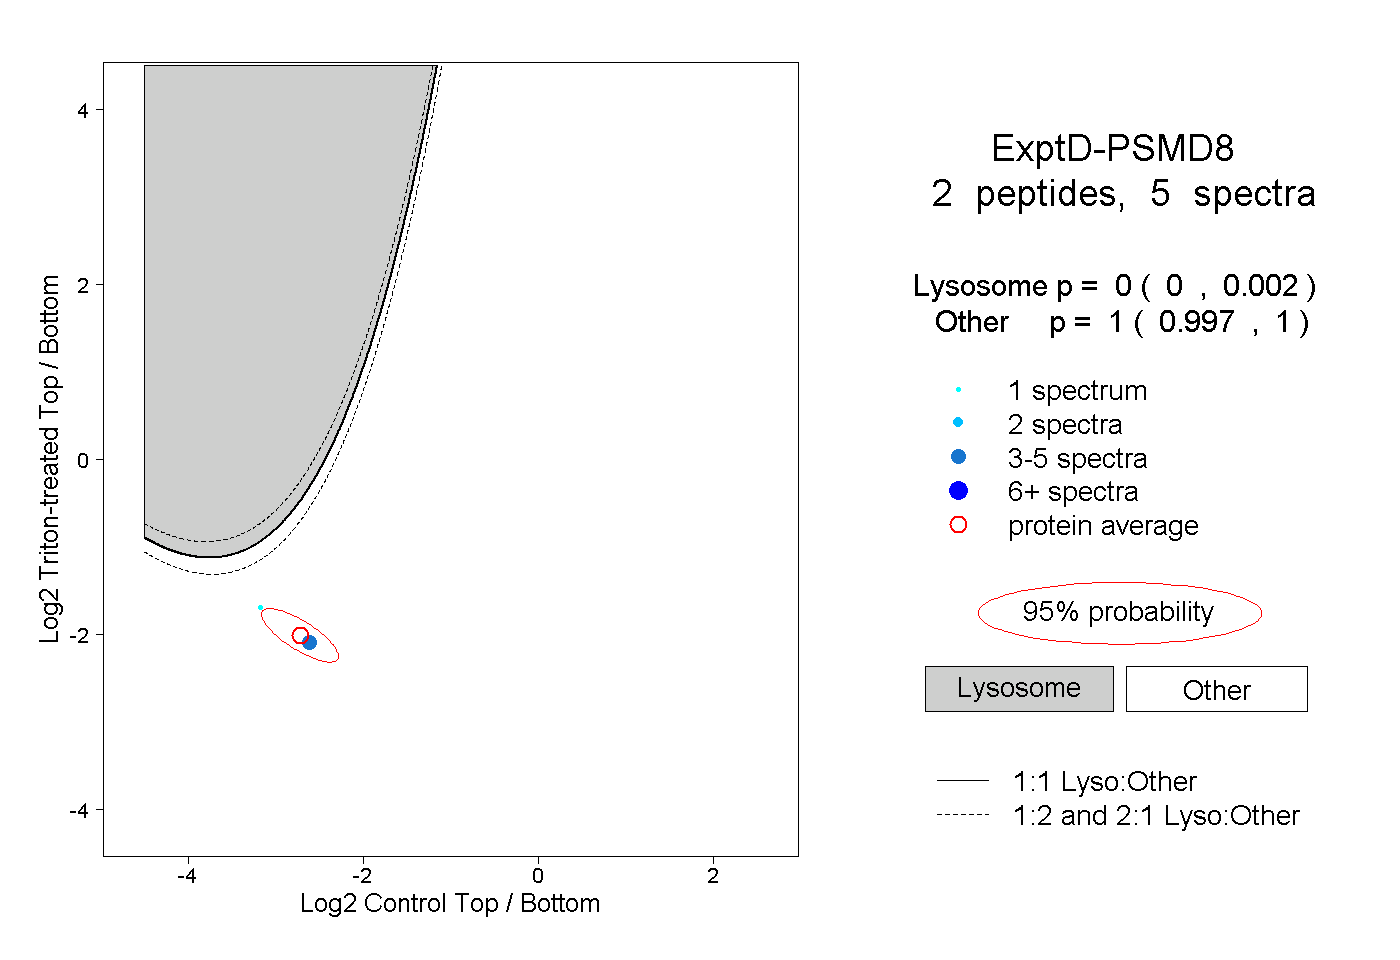
0.000 | 0.002
0.997 | 1.000