 14
14peptides
spectra

0.000 | 0.000
0.000 | 0.000
0.000 | 0.000
0.000 | 0.000
0.000 | 0.000
0.000 | 0.000
0.972 | 0.981
0.018 | 0.027
| Plot | Mito | Lyso | Perox | ER | Golgi | PM | Cytosol | Nucleus | |||||
| Expt A |
14 peptides |
30 spectra |
|
0.000 0.000 | 0.000 |
0.000 0.000 | 0.000 |
0.000 0.000 | 0.000 |
0.000 0.000 | 0.000 |
0.000 0.000 | 0.000 |
0.000 0.000 | 0.000 |
0.977 0.972 | 0.981 |
0.023 0.018 | 0.027 |
| 2 spectra, QVIEYAR | 0.000 | 0.000 | 0.000 | 0.000 | 0.000 | 0.000 | 0.959 | 0.041 | ||
| 1 spectrum, DIQTNVYIK | 0.000 | 0.000 | 0.000 | 0.000 | 0.000 | 0.000 | 0.970 | 0.030 | ||
| 6 spectra, DIPSFER | 0.000 | 0.000 | 0.000 | 0.000 | 0.000 | 0.000 | 0.934 | 0.066 | ||
| 3 spectra, YMAQLK | 0.000 | 0.000 | 0.000 | 0.000 | 0.000 | 0.000 | 0.964 | 0.036 | ||
| 1 spectrum, QQLILAR | 0.000 | 0.000 | 0.000 | 0.000 | 0.000 | 0.000 | 1.000 | 0.000 | ||
| 1 spectrum, MTDYAK | 0.000 | 0.000 | 0.000 | 0.000 | 0.044 | 0.124 | 0.833 | 0.000 | ||
| 2 spectra, CGEELGR | 0.006 | 0.000 | 0.000 | 0.000 | 0.060 | 0.000 | 0.930 | 0.004 | ||
| 1 spectrum, CYYFDYK | 0.000 | 0.000 | 0.000 | 0.000 | 0.000 | 0.000 | 0.875 | 0.125 | ||
| 1 spectrum, HPVSHEQYLMEGSYNK | 0.000 | 0.000 | 0.000 | 0.000 | 0.000 | 0.179 | 0.821 | 0.000 | ||
| 1 spectrum, DILEIGAQWSILCK | 0.000 | 0.000 | 0.000 | 0.000 | 0.000 | 0.000 | 0.905 | 0.095 | ||
| 6 spectra, VAEFHTELER | 0.000 | 0.000 | 0.000 | 0.000 | 0.034 | 0.000 | 0.966 | 0.000 | ||
| 1 spectrum, ILFFSTPK | 0.112 | 0.000 | 0.000 | 0.000 | 0.000 | 0.000 | 0.888 | 0.000 | ||
| 3 spectra, ILFAEATR | 0.000 | 0.000 | 0.000 | 0.000 | 0.000 | 0.000 | 0.995 | 0.005 | ||
| 1 spectrum, DEIAGCIEK | 0.000 | 0.000 | 0.125 | 0.040 | 0.081 | 0.000 | 0.754 | 0.000 |
| Plot | Mito | Lyso or Perox | ER | Golgi | PM | Cytosol | Nucleus | ||||||
| Expt B |
7 peptides |
21 spectra |
 |
0.000 0.000 | 0.000 |
0.000 0.000 | 0.000 |
0.000 0.000 | 0.000 |
0.043 0.029 | 0.052 |
0.000 0.000 | 0.000 |
0.957 0.947 | 0.964 |
0.000 0.000 | 0.009 |
|||
| Plot | Lyso | Other | |||||||||||
| Expt C |
12 peptides |
34 spectra |
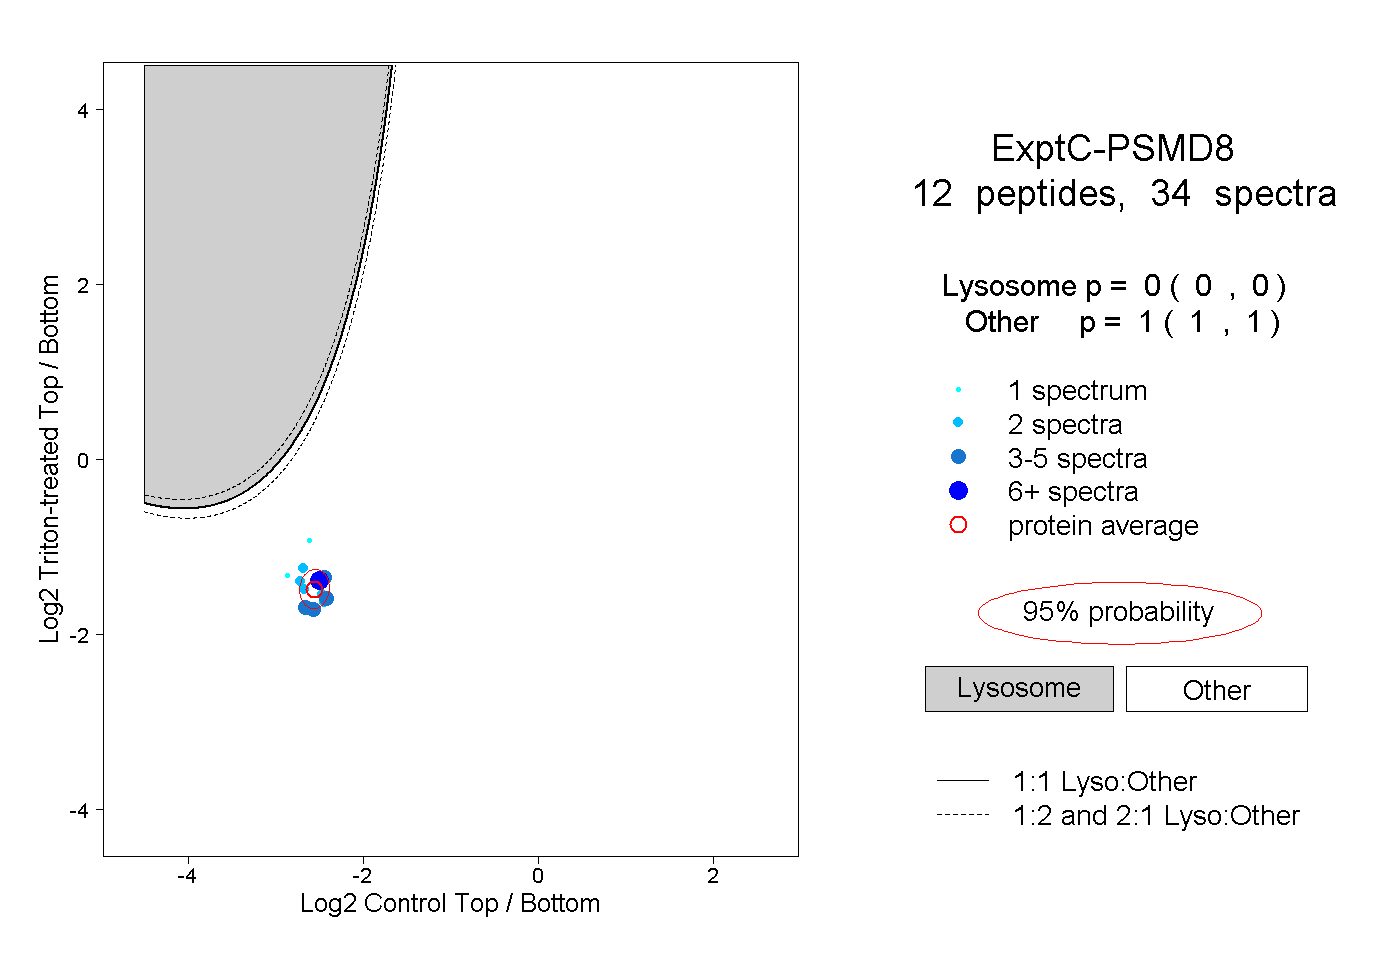 |
0.000 0.000 | 0.000 |
1.000 1.000 | 1.000 |
||||||||
| Plot | Lyso | Other | |||||||||||
| Expt D |
2 peptides |
5 spectra |
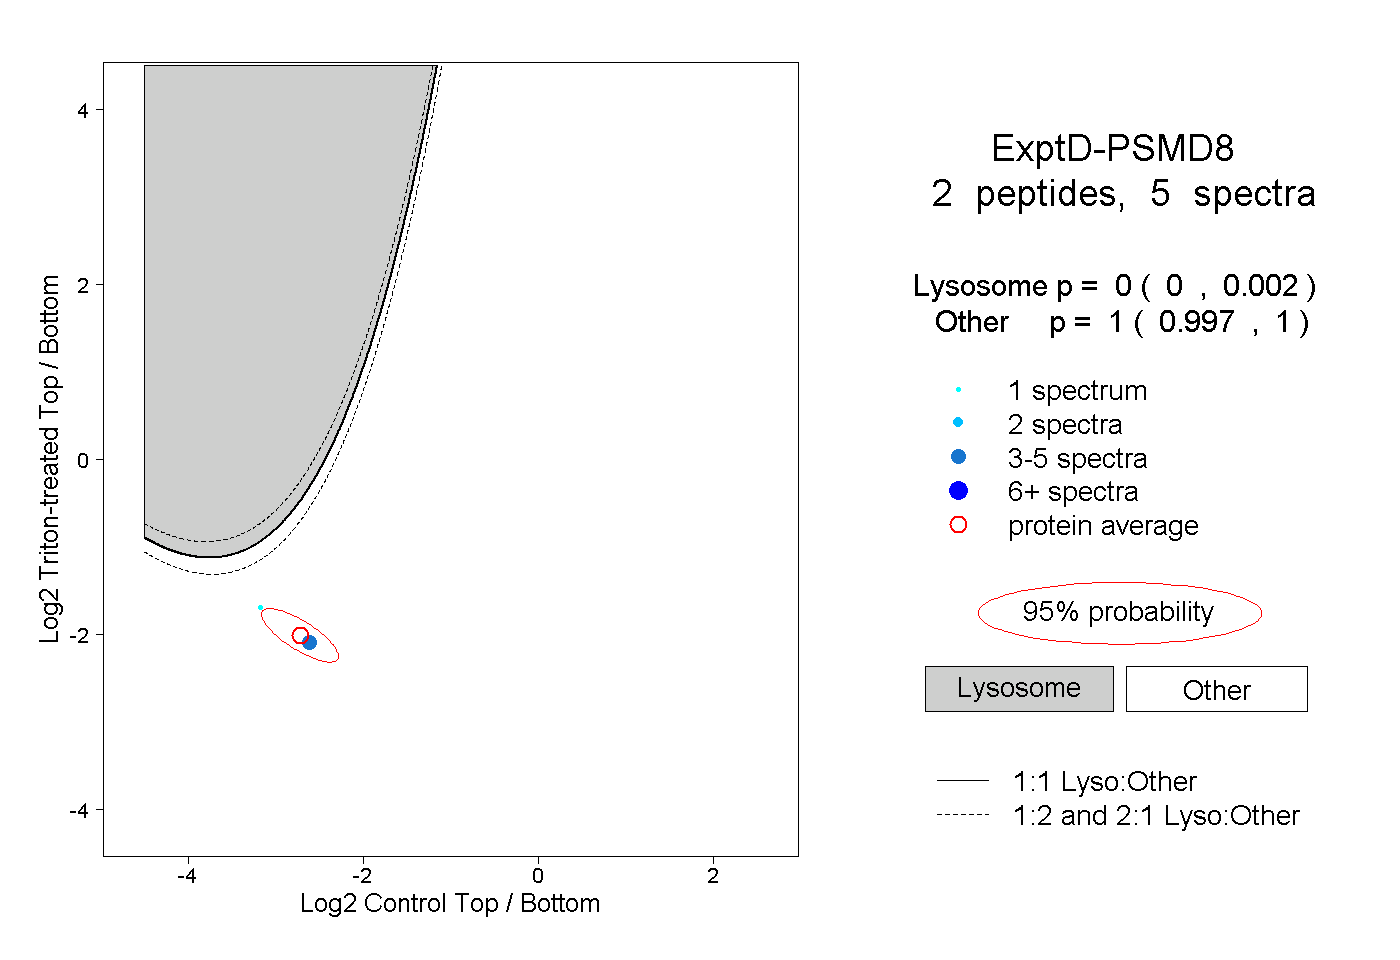 |
0.000 0.000 | 0.002 |
1.000 0.997 | 1.000 |