 8
8peptides
spectra
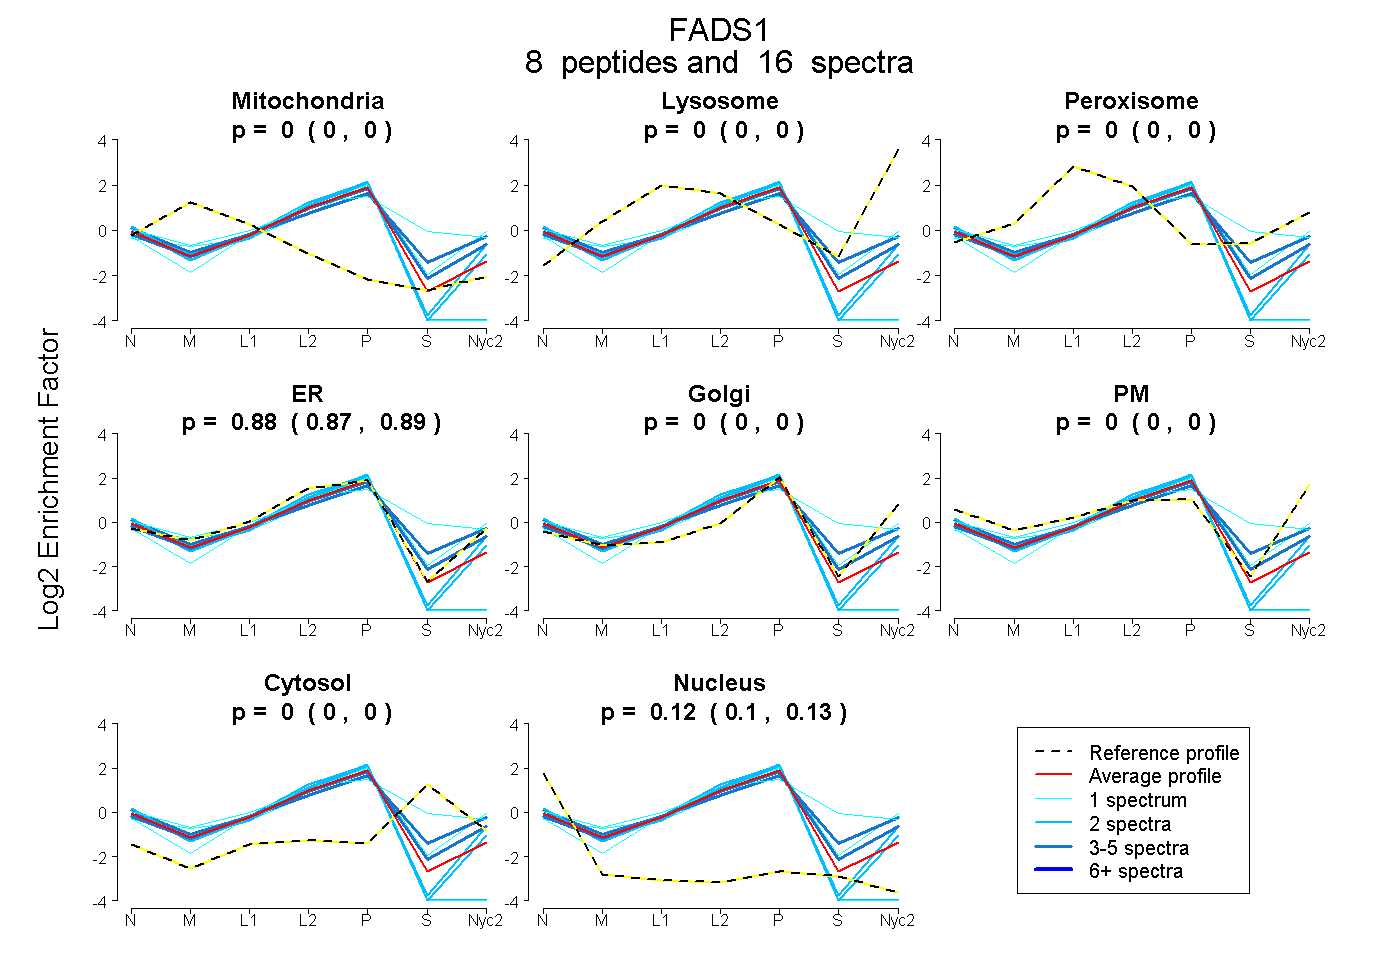
0.000 | 0.000
0.000 | 0.000
0.000 | 0.000
0.871 | 0.895
0.000 | 0.000
0.000 | 0.000
0.000 | 0.000
0.102 | 0.127
3peptides
spectra
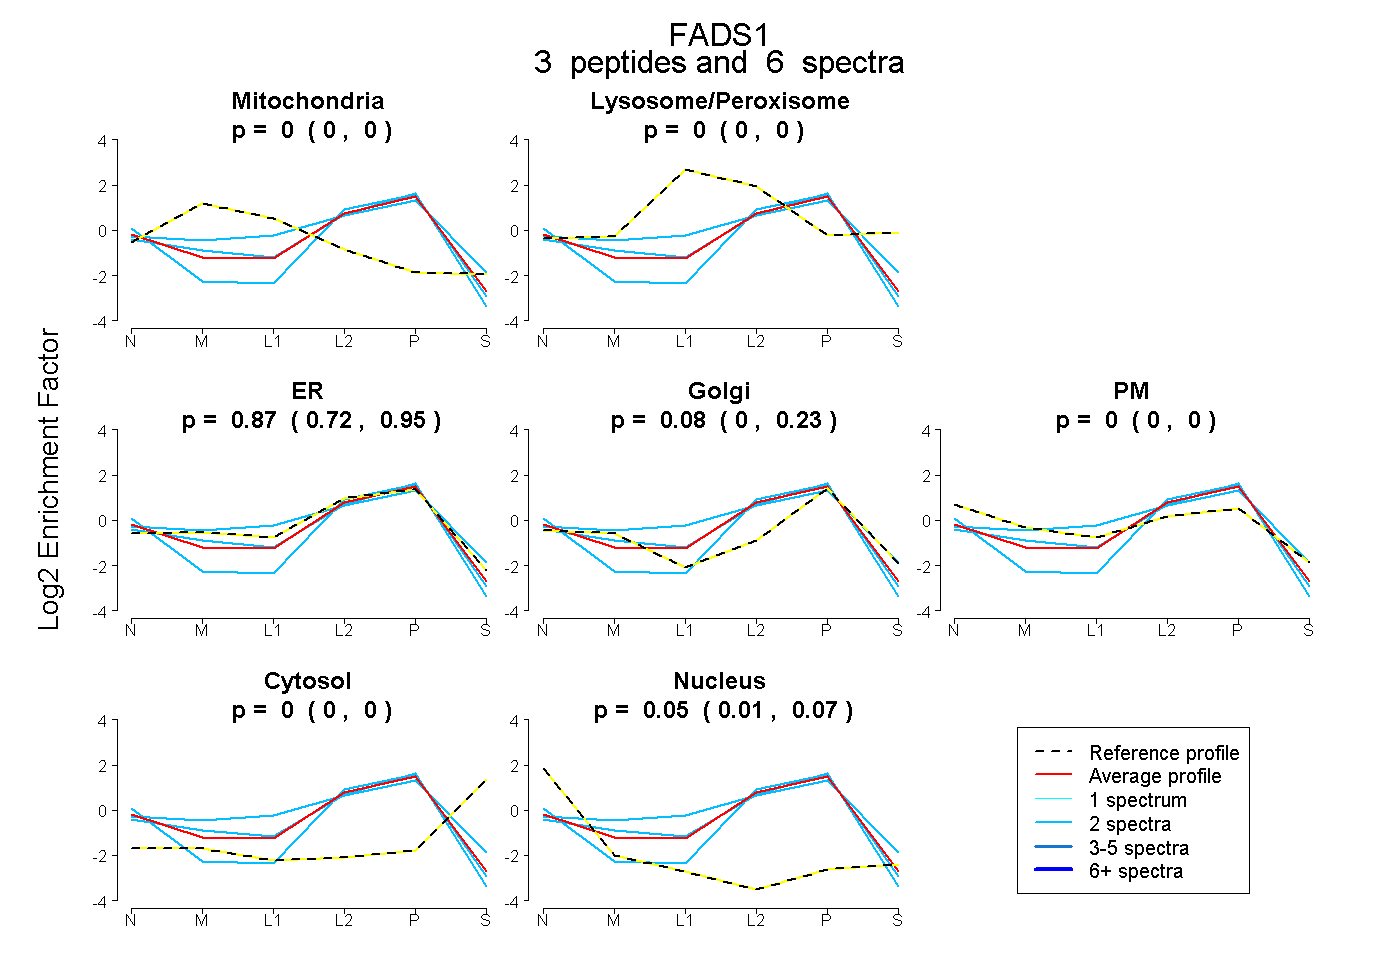
0.000 | 0.000
0.000 | 0.000
0.718 | 0.945
0.000 | 0.229
0.000 | 0.000
0.000 | 0.000
0.015 | 0.075
6peptides
spectra
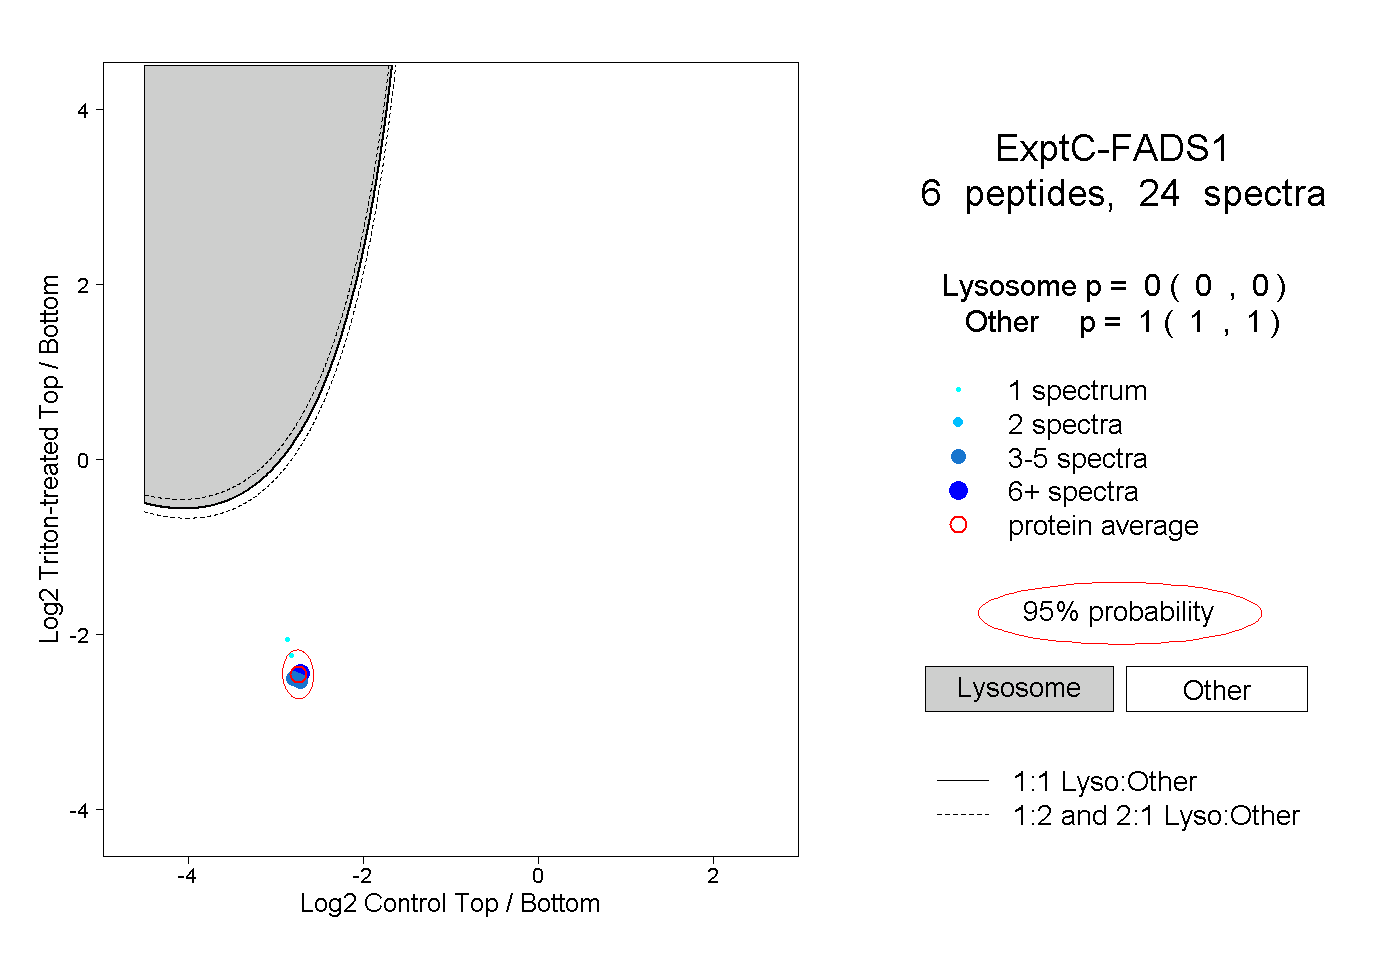
0.000 | 0.000
1.000 | 1.000
1peptide
spectra
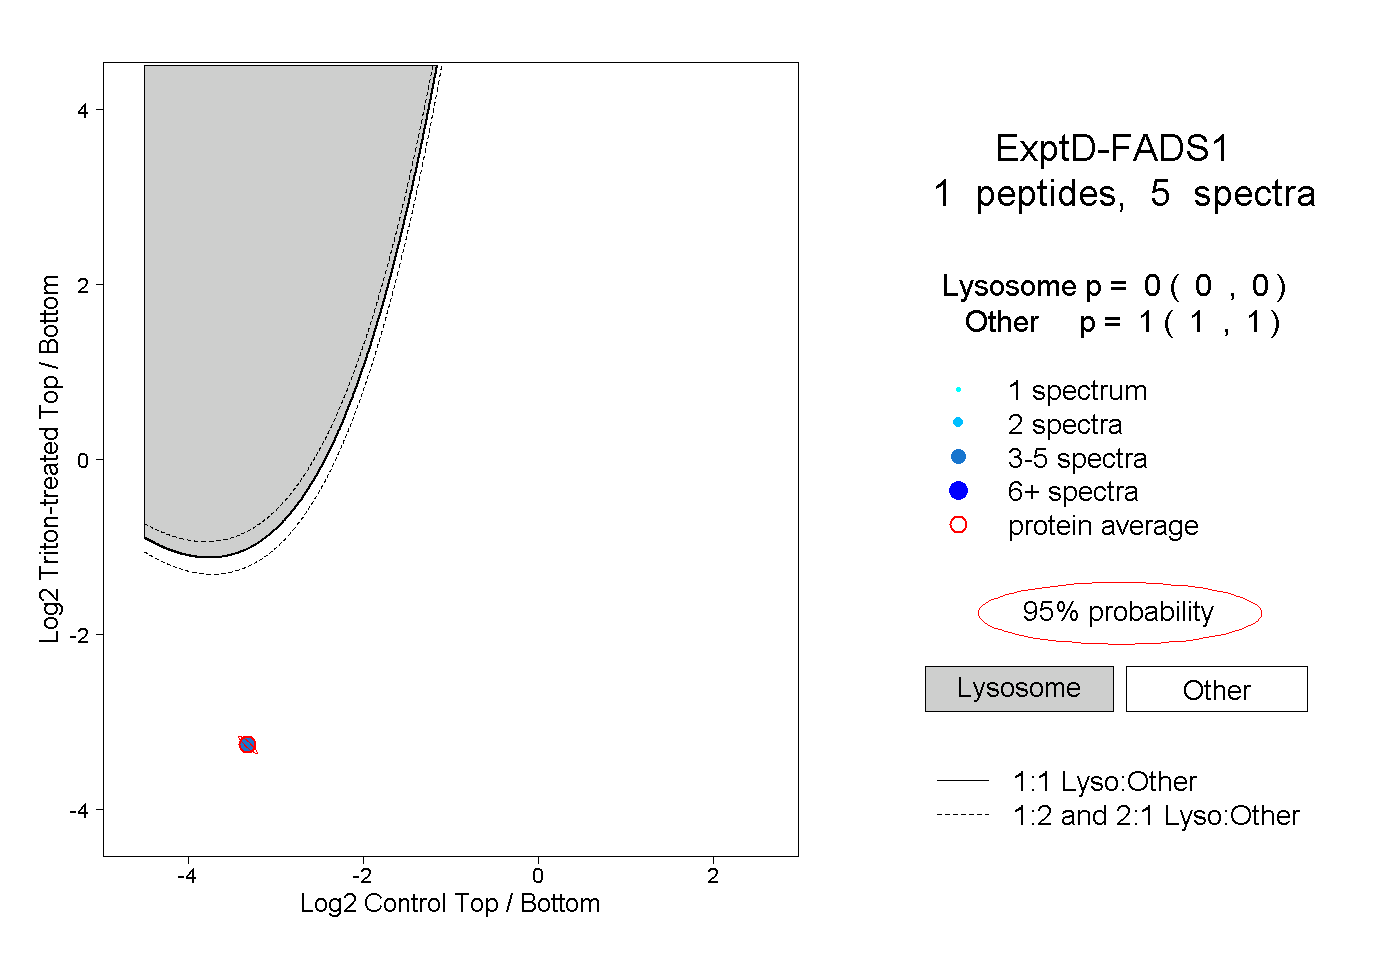
0.000 | 0.000
1.000 | 1.000