FADS1
[ENSRNOP00000027834]
Main page
| | | Plot |
Mito |
Lyso |
|
Perox |
ER |
Golgi |
PM |
Cytosol |
Nucleus |
|
| Expt A |
 8
8
peptides |
16
spectra |
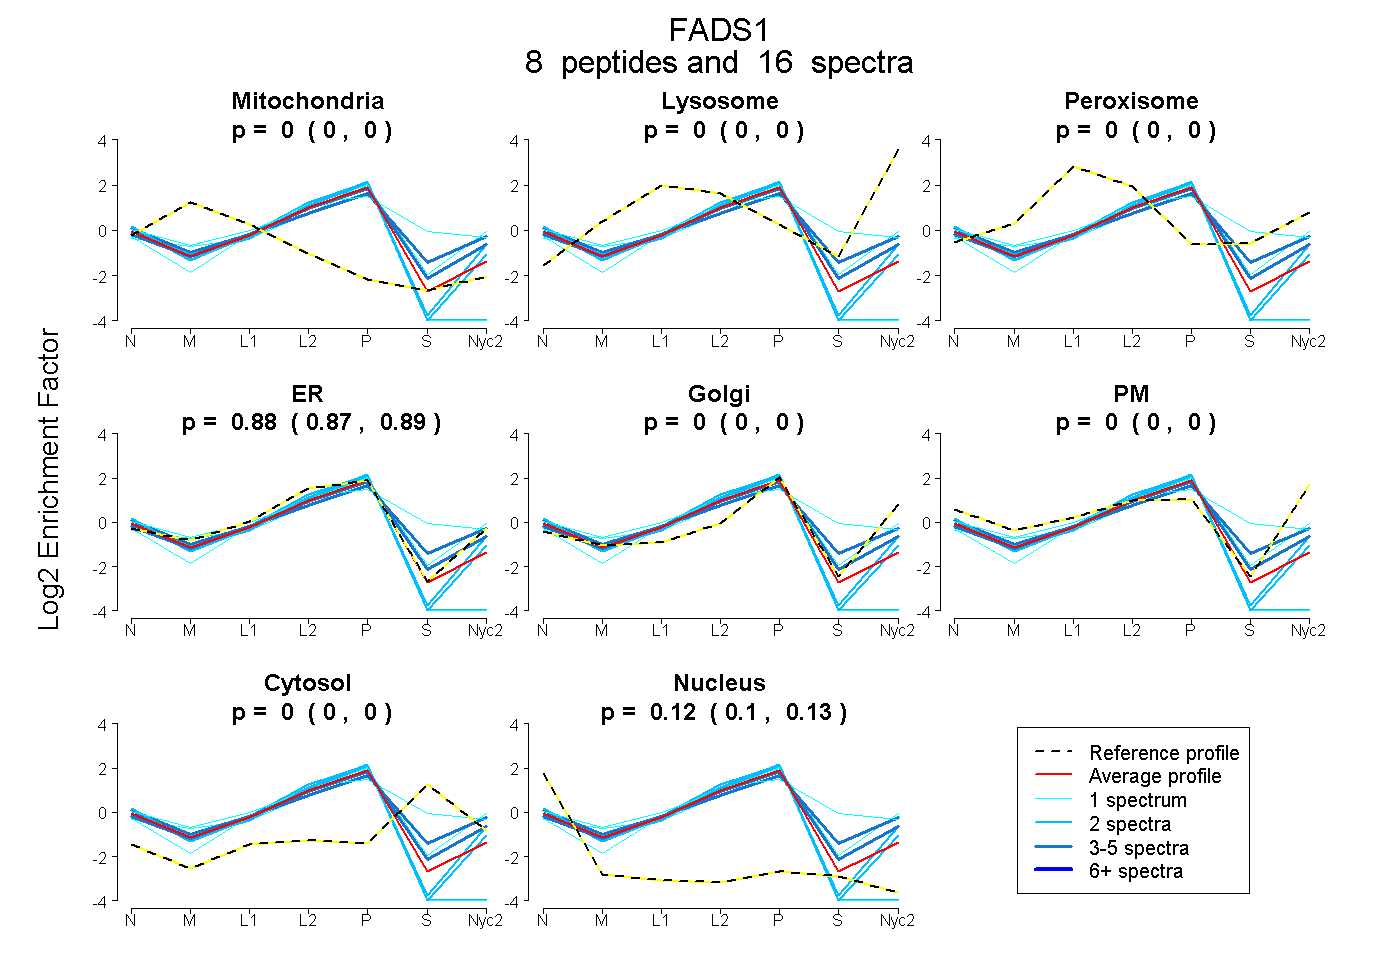 |
0.000
0.000 | 0.000 |
0.000
0.000 | 0.000 |
|
0.000
0.000 | 0.000 |
0.884
0.871 | 0.895 |
0.000
0.000 | 0.000 |
0.000
0.000 | 0.000 |
0.000
0.000 | 0.000 |
0.116
0.102 | 0.127 |
|
| | | Plot |
Mito |
|
Lyso or Perox |
|
ER |
Golgi |
PM |
Cytosol |
Nucleus |
|
| Expt B |
3
peptides |
6
spectra |
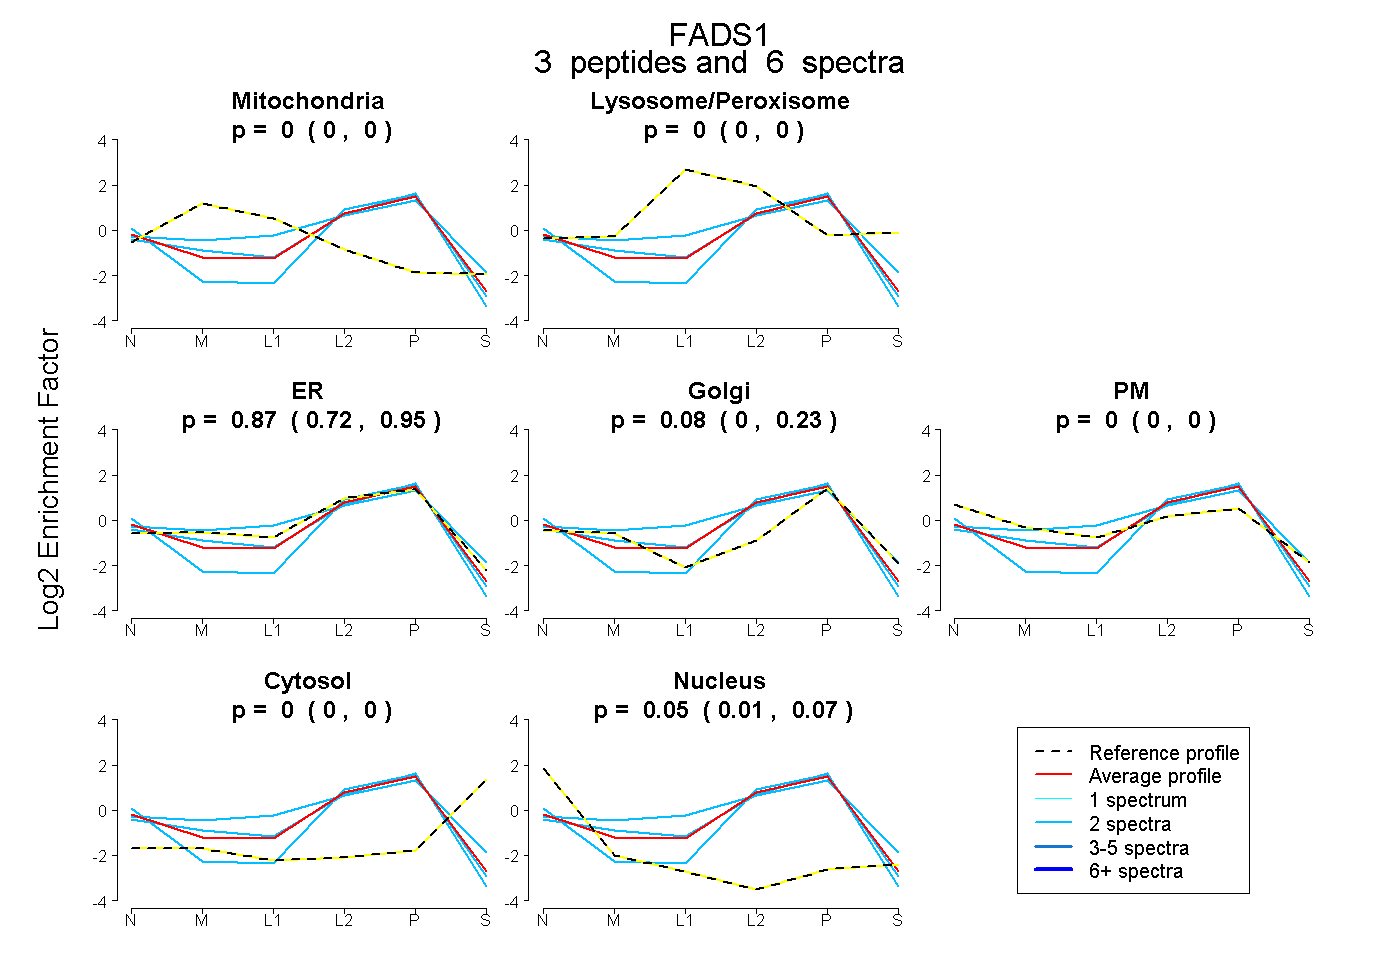 |
0.000
0.000 | 0.000 |
|
0.000
0.000 | 0.000 |
|
0.868
0.718 | 0.945 |
0.080
0.000 | 0.229 |
0.000
0.000 | 0.000 |
0.000
0.000 | 0.000 |
0.052
0.015 | 0.075 |
|
| 2 spectra, ALTDEFR |
0.000 |
|
0.000 |
|
0.870 |
0.110 |
0.000 |
0.000 |
0.020 |
|
| 2 spectra, VAPLVQSLCAK |
0.000 |
|
0.000 |
|
0.689 |
0.221 |
0.000 |
0.000 |
0.090 |
|
| 2 spectra, VLSVELGK |
0.000 |
|
0.149 |
|
0.605 |
0.128 |
0.118 |
0.000 |
0.000 |
|
| | | Plot |
|
Lyso |
|
|
|
|
|
|
|
Other |
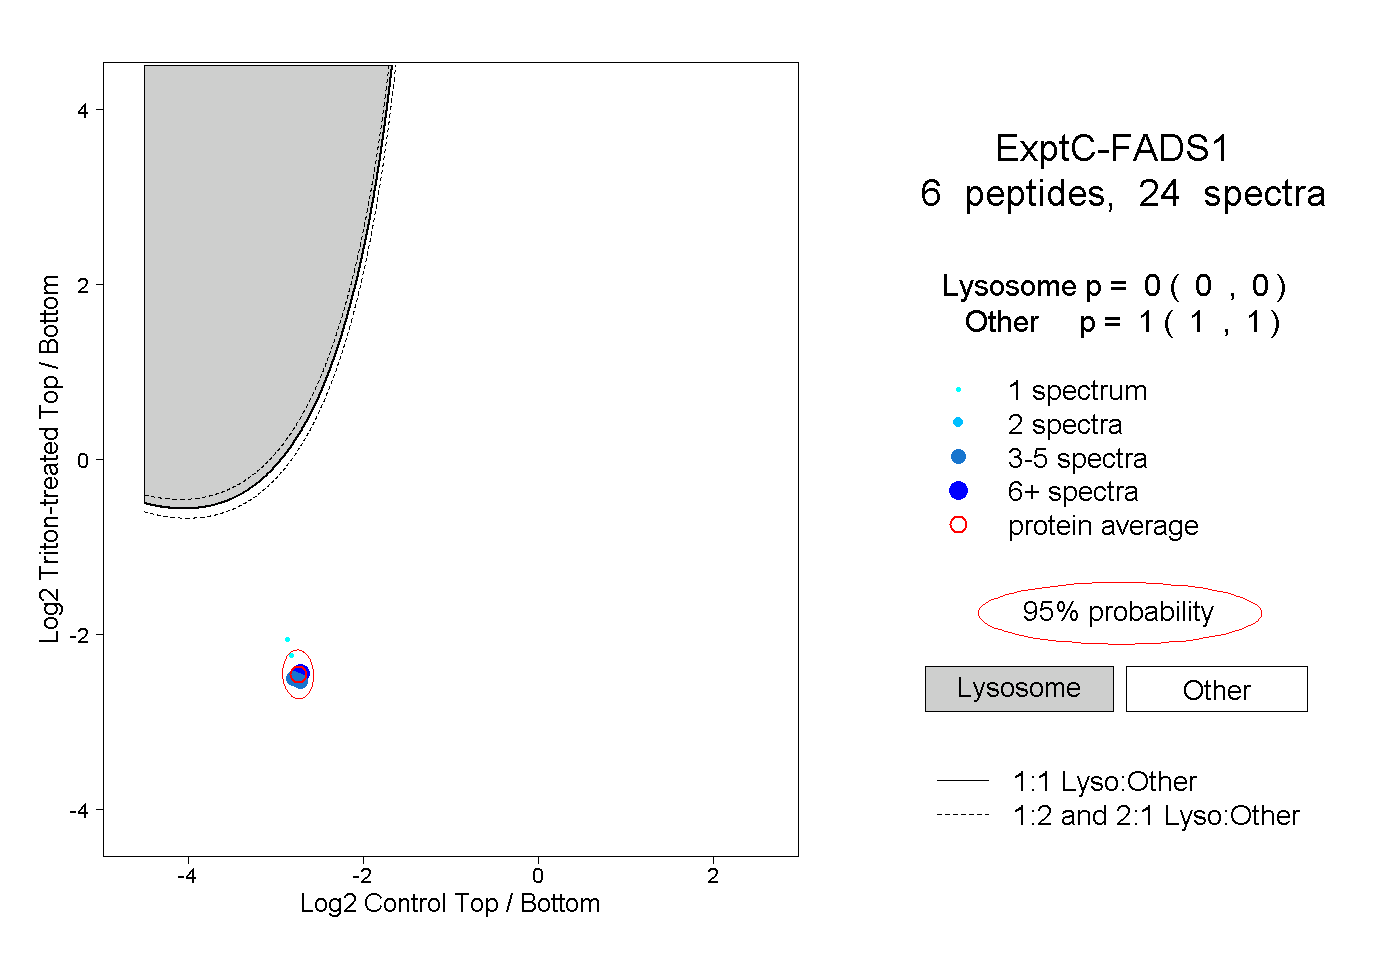
| Expt C |
6
peptides |
24
spectra |
 |
|
0.000
0.000 | 0.000 |
|
|
|
|
|
|
|
1.000
1.000 | 1.000 |
| | | Plot |
|
Lyso |
|
|
|
|
|
|
|
Other |
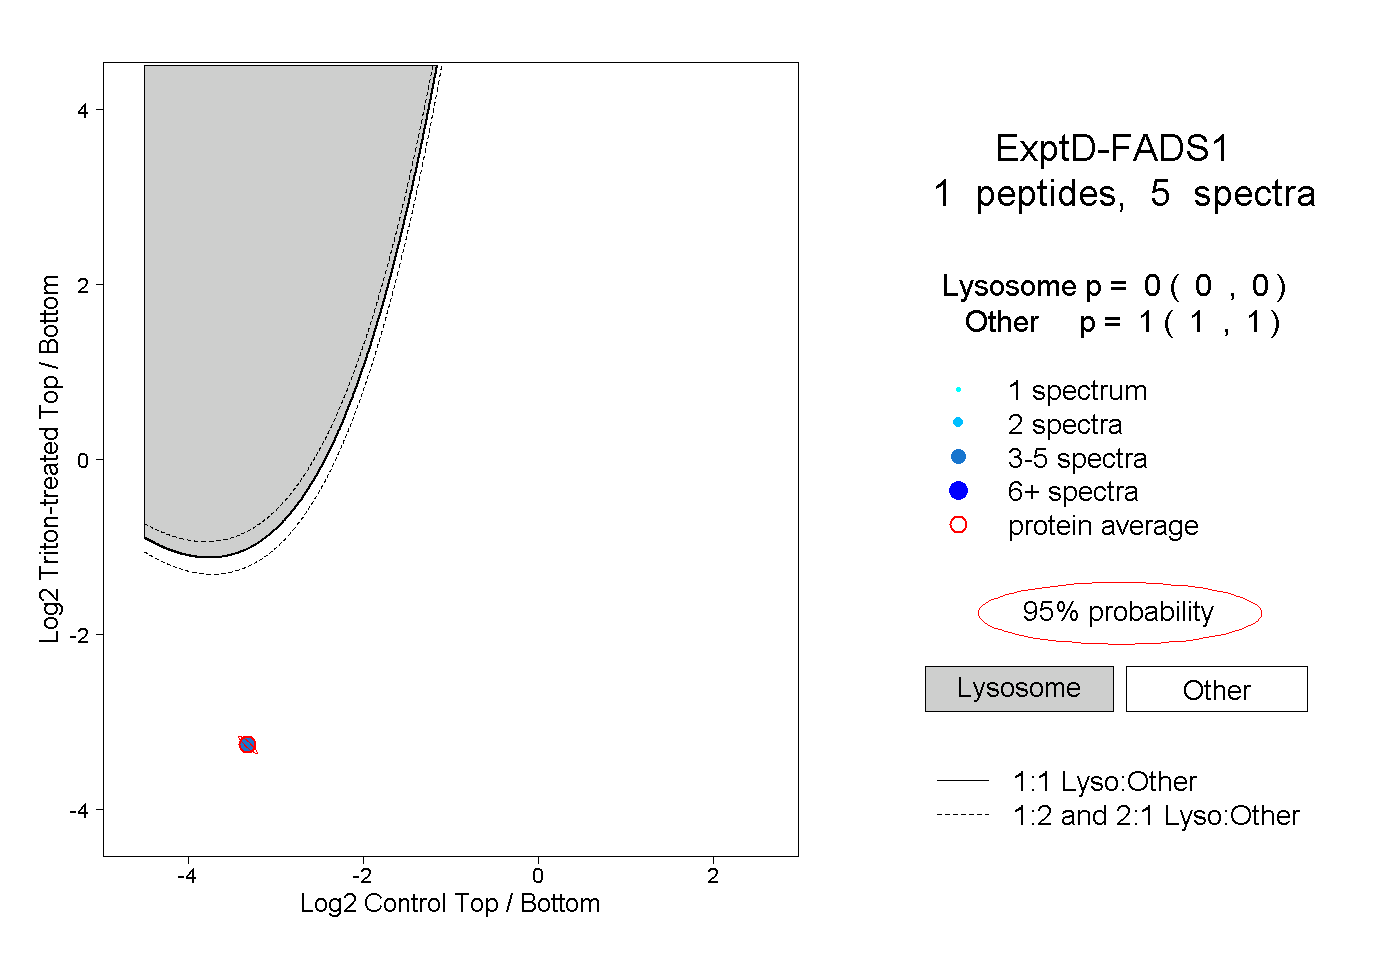
| Expt D |
1
peptide |
5
spectra |
 |
|
0.000
0.000 | 0.000 |
|
|
|
|
|
|
|
1.000
1.000 | 1.000 |