 10
10peptides
spectra
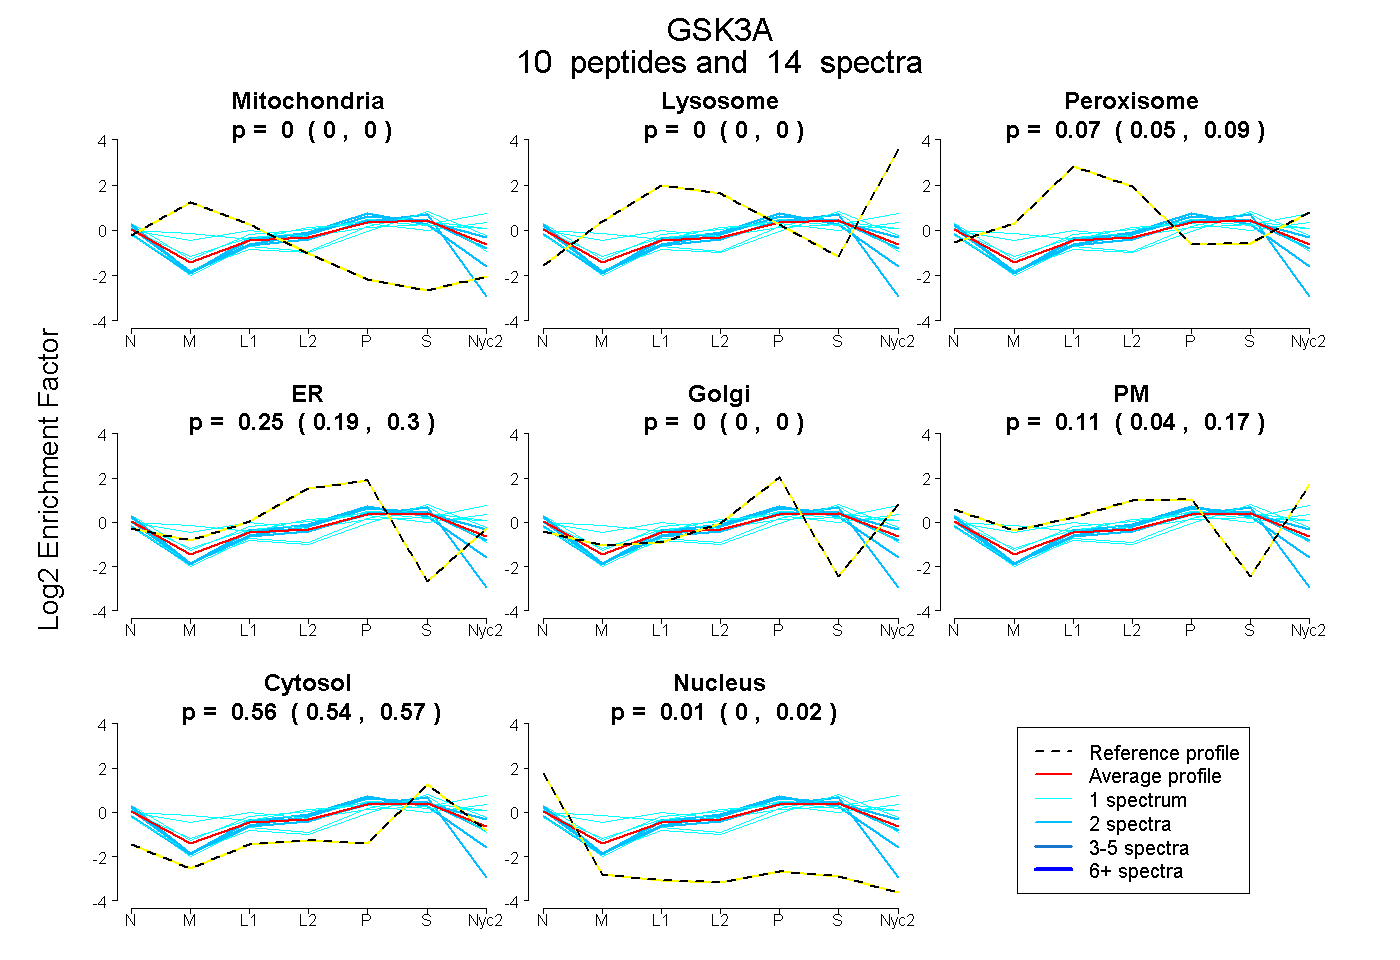
0.000 | 0.000
0.000 | 0.000
0.051 | 0.089
0.192 | 0.297
0.000 | 0.000
0.035 | 0.172
0.542 | 0.569
0.000 | 0.021
3peptides
spectra
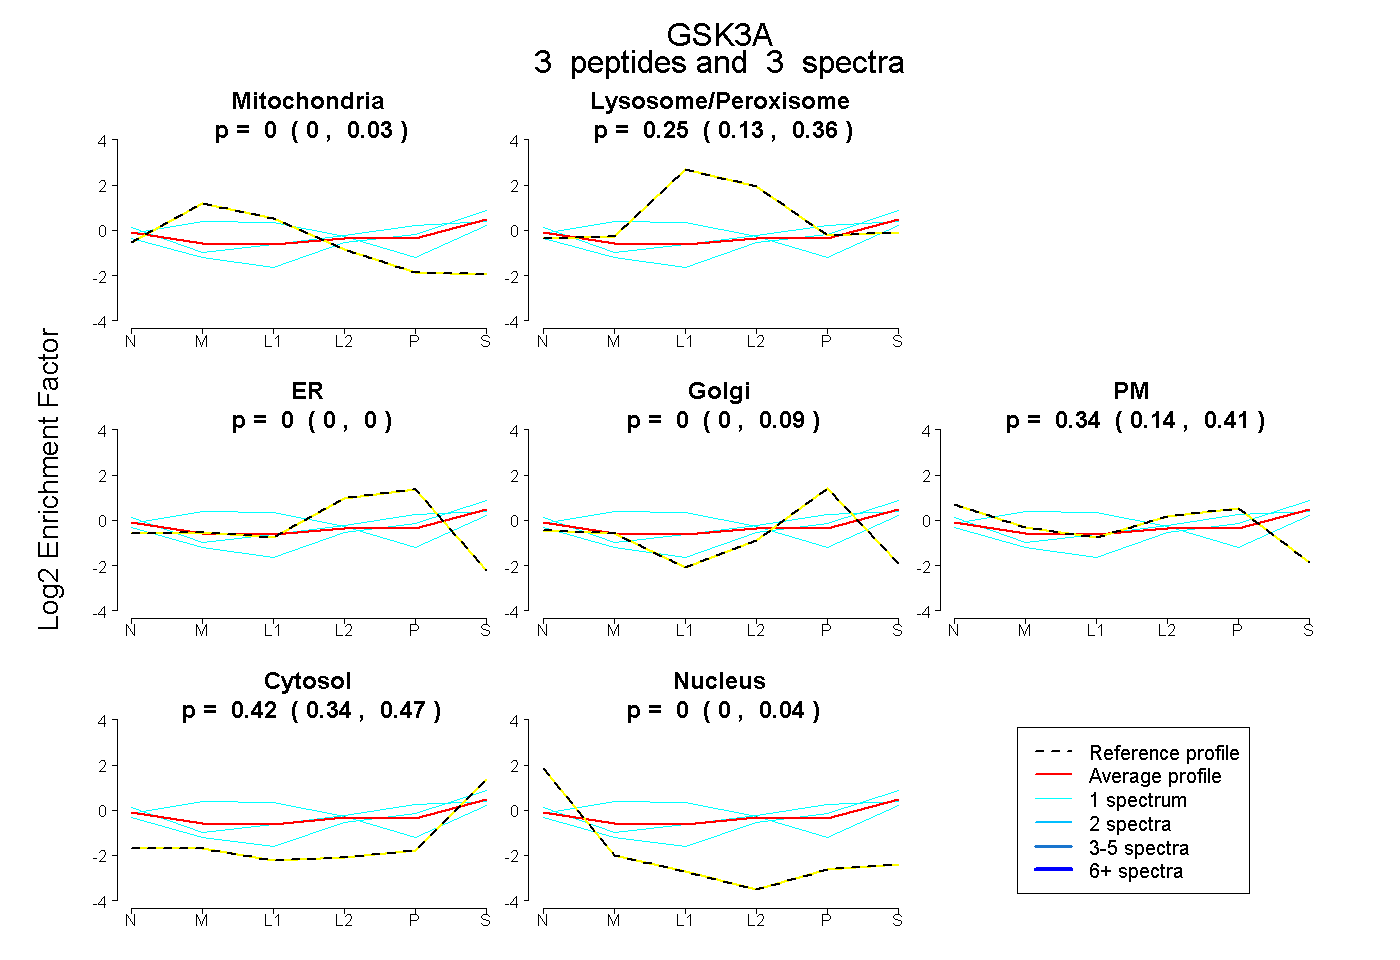
0.000 | 0.031
0.133 | 0.356
0.000 | 0.000
0.000 | 0.088
0.137 | 0.410
0.337 | 0.471
0.000 | 0.037
6peptides
spectra
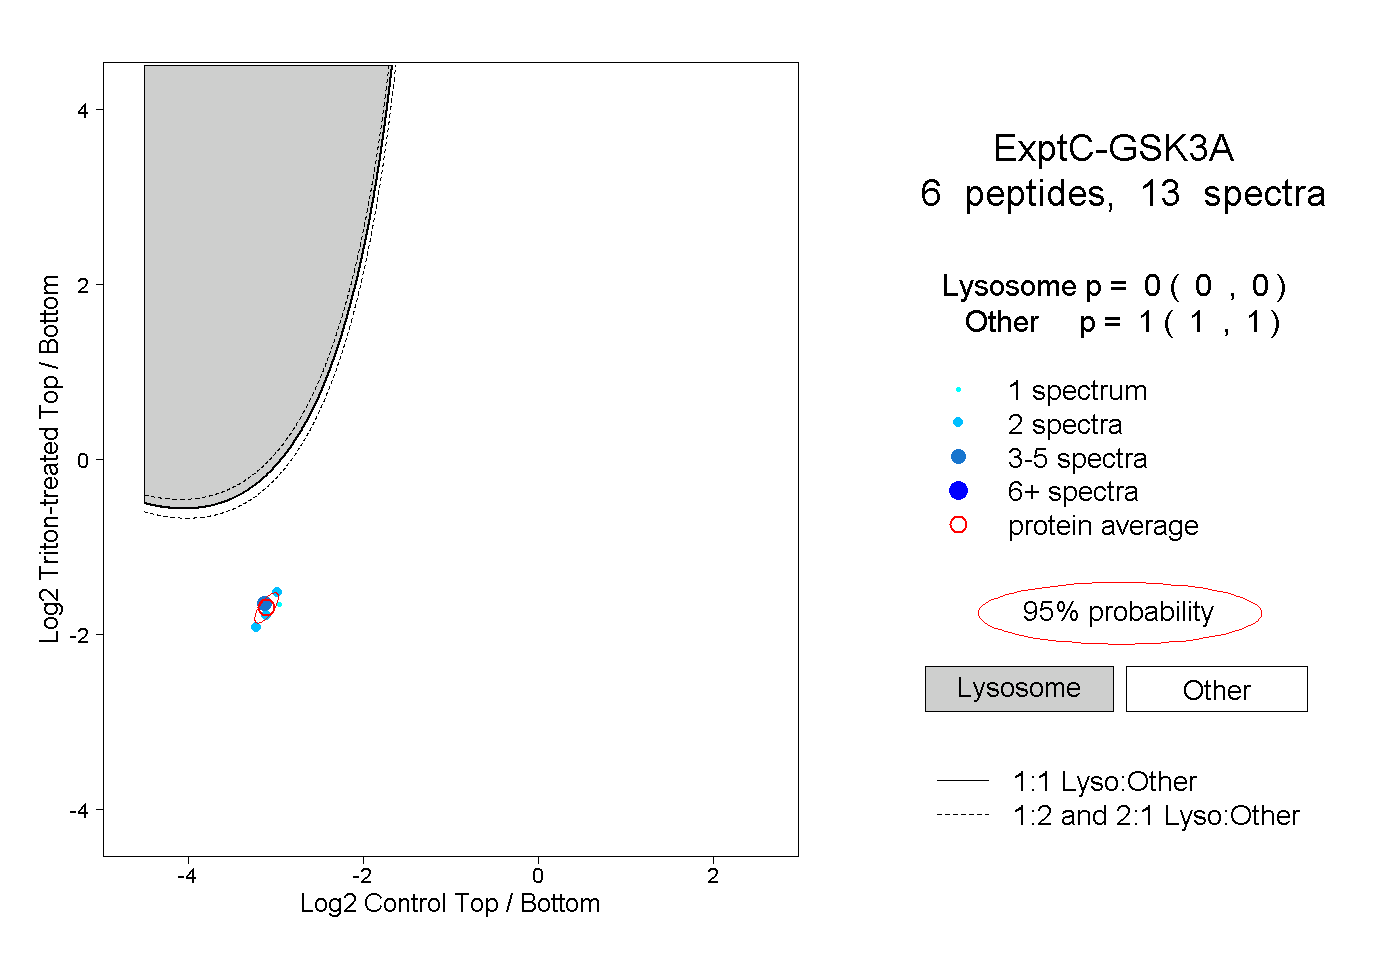
0.000 | 0.000
1.000 | 1.000