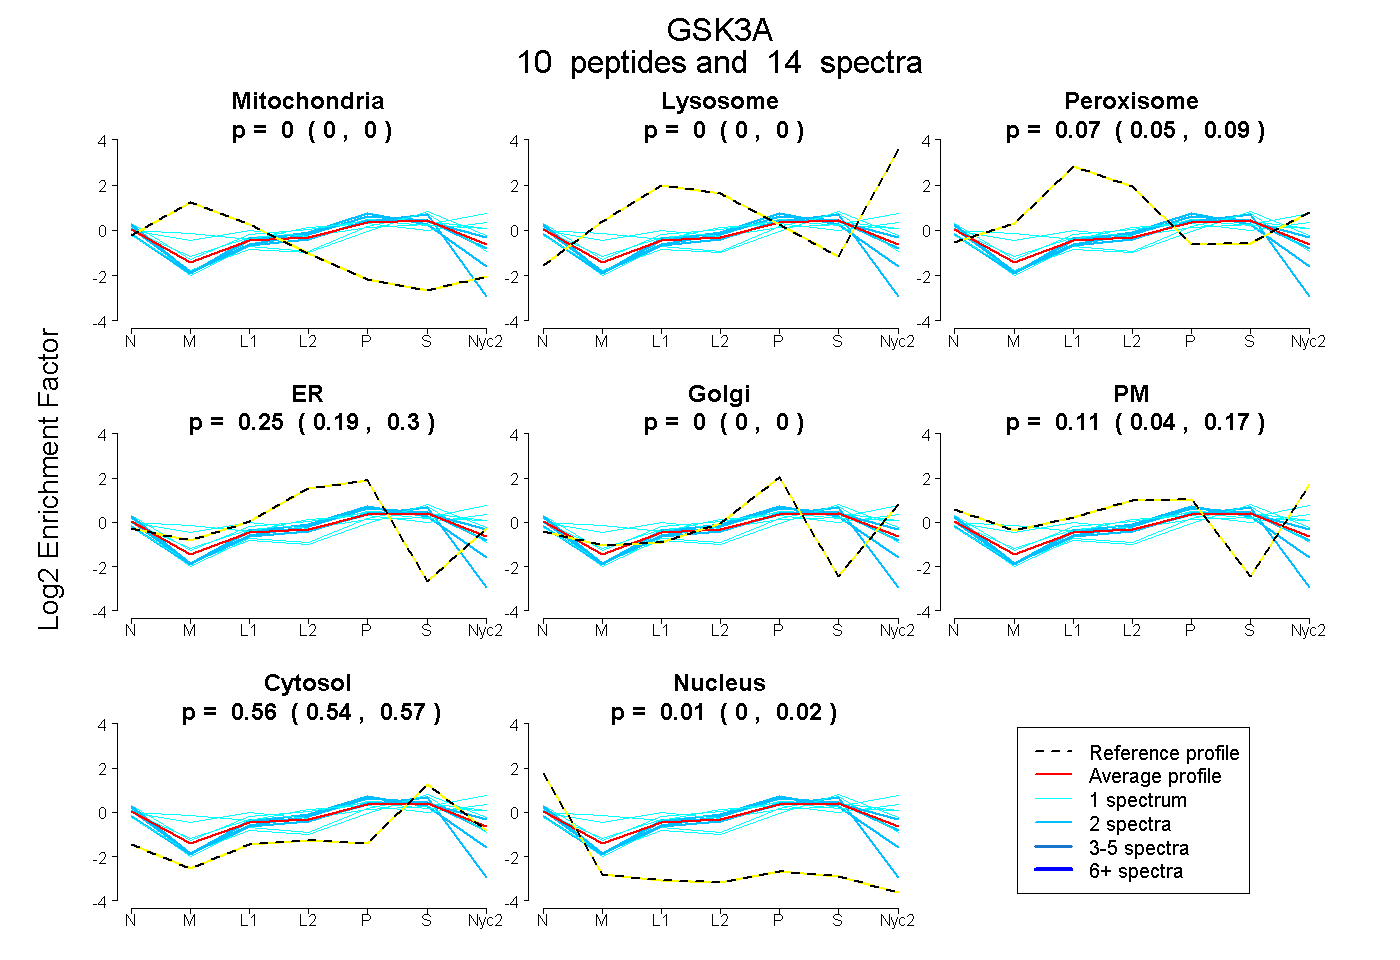
 10
10peptides
spectra
0.000 | 0.000
0.000 | 0.000
0.051 | 0.089
0.192 | 0.297
0.000 | 0.000
0.035 | 0.172
0.542 | 0.569
0.000 | 0.021
| Plot | Mito | Lyso | Perox | ER | Golgi | PM | Cytosol | Nucleus | |||||
| Expt A |
10 peptides |
14 spectra |
|
0.000 0.000 | 0.000 |
0.000 0.000 | 0.000 |
0.070 0.051 | 0.089 |
0.252 0.192 | 0.297 |
0.000 0.000 | 0.000 |
0.112 0.035 | 0.172 |
0.559 0.542 | 0.569 |
0.007 0.000 | 0.021 |
| 2 spectra, YFFYSSGEK | 0.000 | 0.000 | 0.000 | 0.145 | 0.003 | 0.263 | 0.584 | 0.005 | ||
| 2 spectra, LCDFGSAK | 0.000 | 0.000 | 0.000 | 0.385 | 0.000 | 0.032 | 0.583 | 0.000 | ||
| 2 spectra, GEPNVSYICSR | 0.000 | 0.000 | 0.008 | 0.435 | 0.000 | 0.000 | 0.503 | 0.054 | ||
| 1 spectrum, VTTVVATLGQGPER | 0.000 | 0.000 | 0.099 | 0.073 | 0.000 | 0.370 | 0.458 | 0.000 | ||
| 1 spectrum, LIIPIIYVK | 0.000 | 0.000 | 0.034 | 0.181 | 0.090 | 0.000 | 0.666 | 0.030 | ||
| 1 spectrum, VYMYQLFR | 0.000 | 0.000 | 0.000 | 0.000 | 0.067 | 0.228 | 0.706 | 0.000 | ||
| 1 spectrum, VLGTPTR | 0.030 | 0.000 | 0.162 | 0.000 | 0.058 | 0.382 | 0.368 | 0.000 | ||
| 1 spectrum, SQEVAYTDIK | 0.000 | 0.058 | 0.152 | 0.000 | 0.000 | 0.369 | 0.421 | 0.000 | ||
| 1 spectrum, EIVAIK | 0.000 | 0.000 | 0.148 | 0.000 | 0.149 | 0.234 | 0.469 | 0.000 | ||
| 2 spectra, LSPLEACAHSFFDELR | 0.000 | 0.000 | 0.016 | 0.305 | 0.000 | 0.000 | 0.572 | 0.108 |
| Plot | Mito | Lyso or Perox | ER | Golgi | PM | Cytosol | Nucleus | ||||||
| Expt B |
3 peptides |
3 spectra |
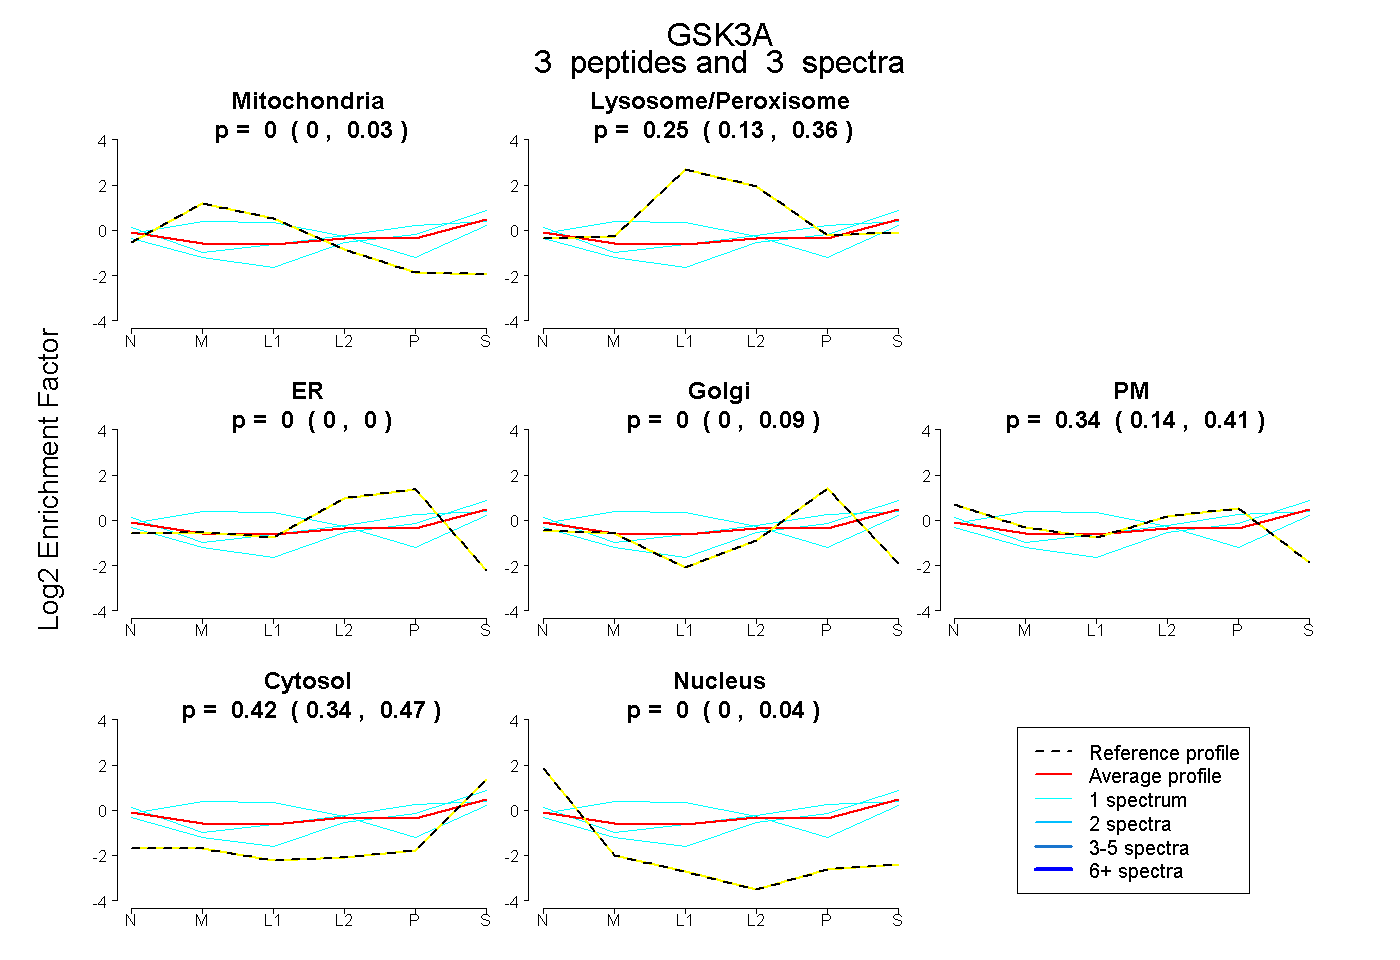 |
0.000 0.000 | 0.031 |
0.246 0.133 | 0.356 |
0.000 0.000 | 0.000 |
0.000 0.000 | 0.088 |
0.335 0.137 | 0.410 |
0.419 0.337 | 0.471 |
0.000 0.000 | 0.037 |
|||
| Plot | Lyso | Other | |||||||||||
| Expt C |
6 peptides |
13 spectra |
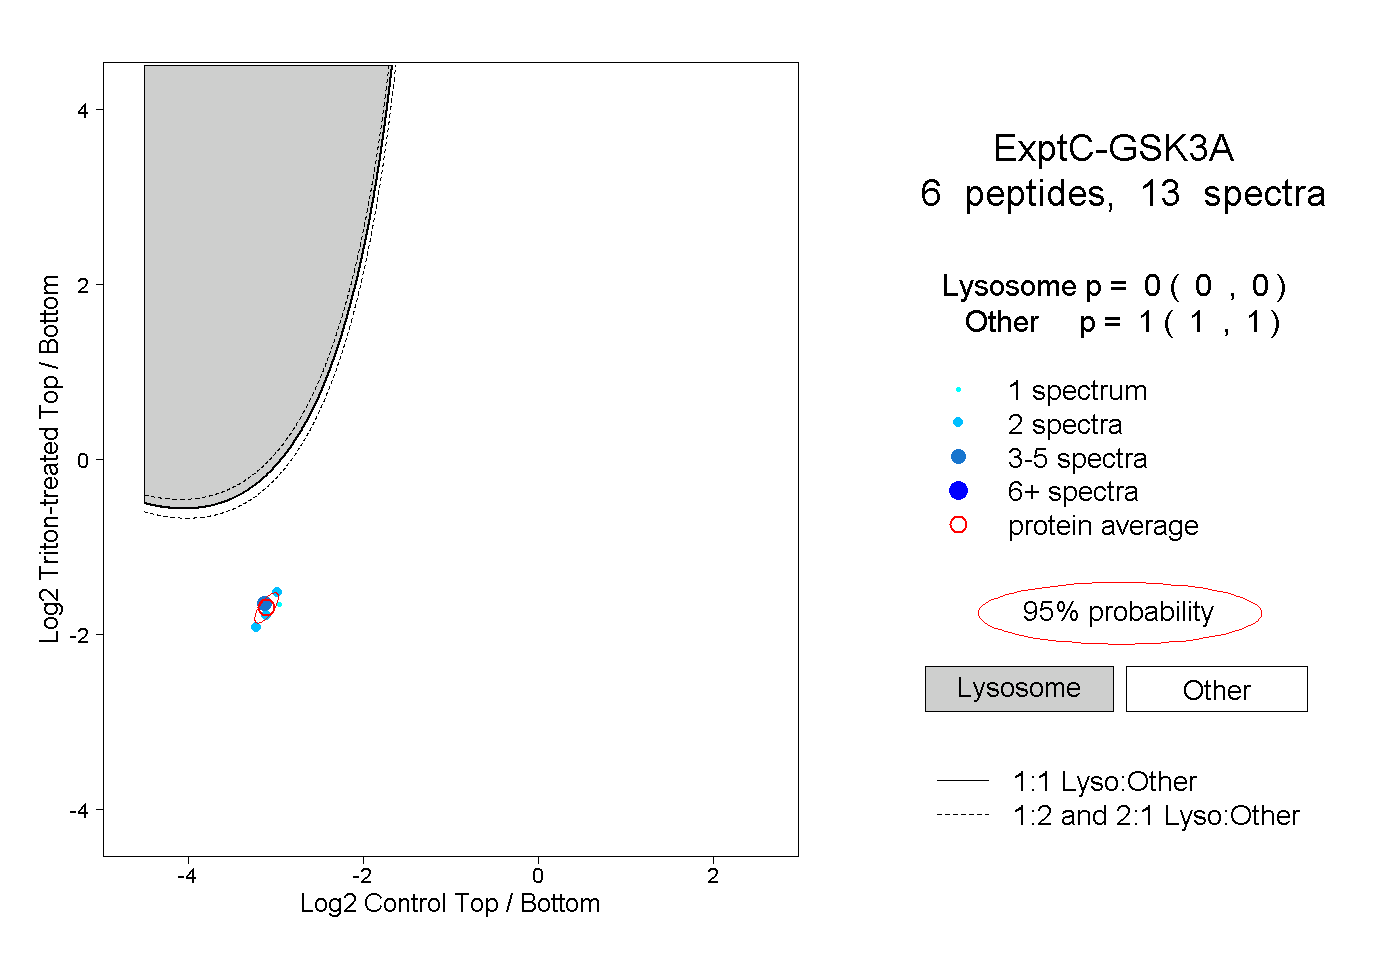 |
0.000 0.000 | 0.000 |
1.000 1.000 | 1.000 |