 4
4peptides
spectra
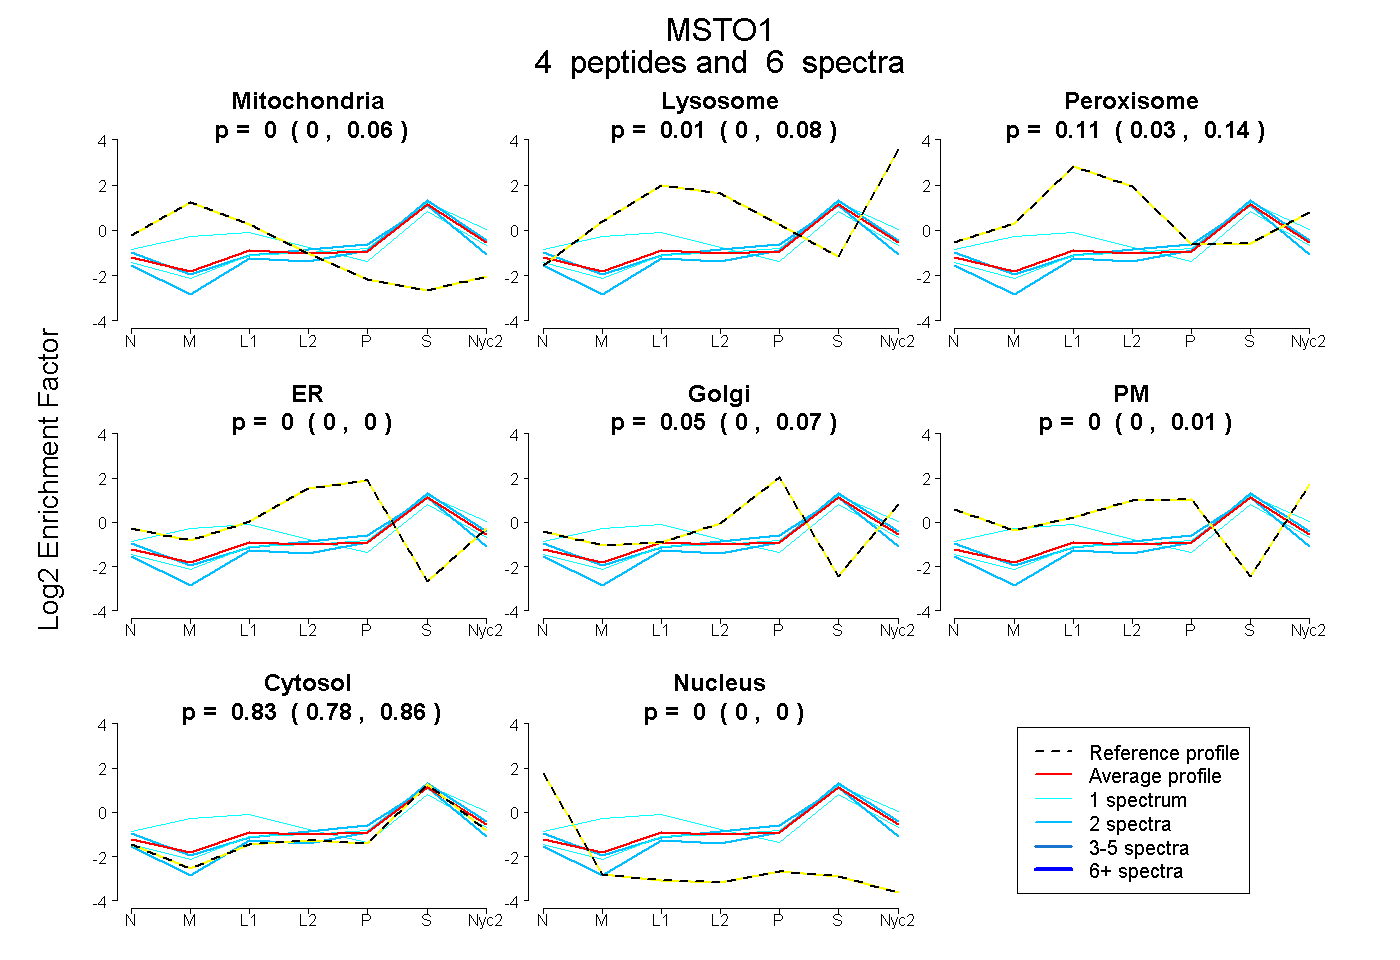
0.000 | 0.055
0.000 | 0.081
0.029 | 0.139
0.000 | 0.000
0.000 | 0.067
0.000 | 0.006
0.784 | 0.863
0.000 | 0.000
3peptides
spectra
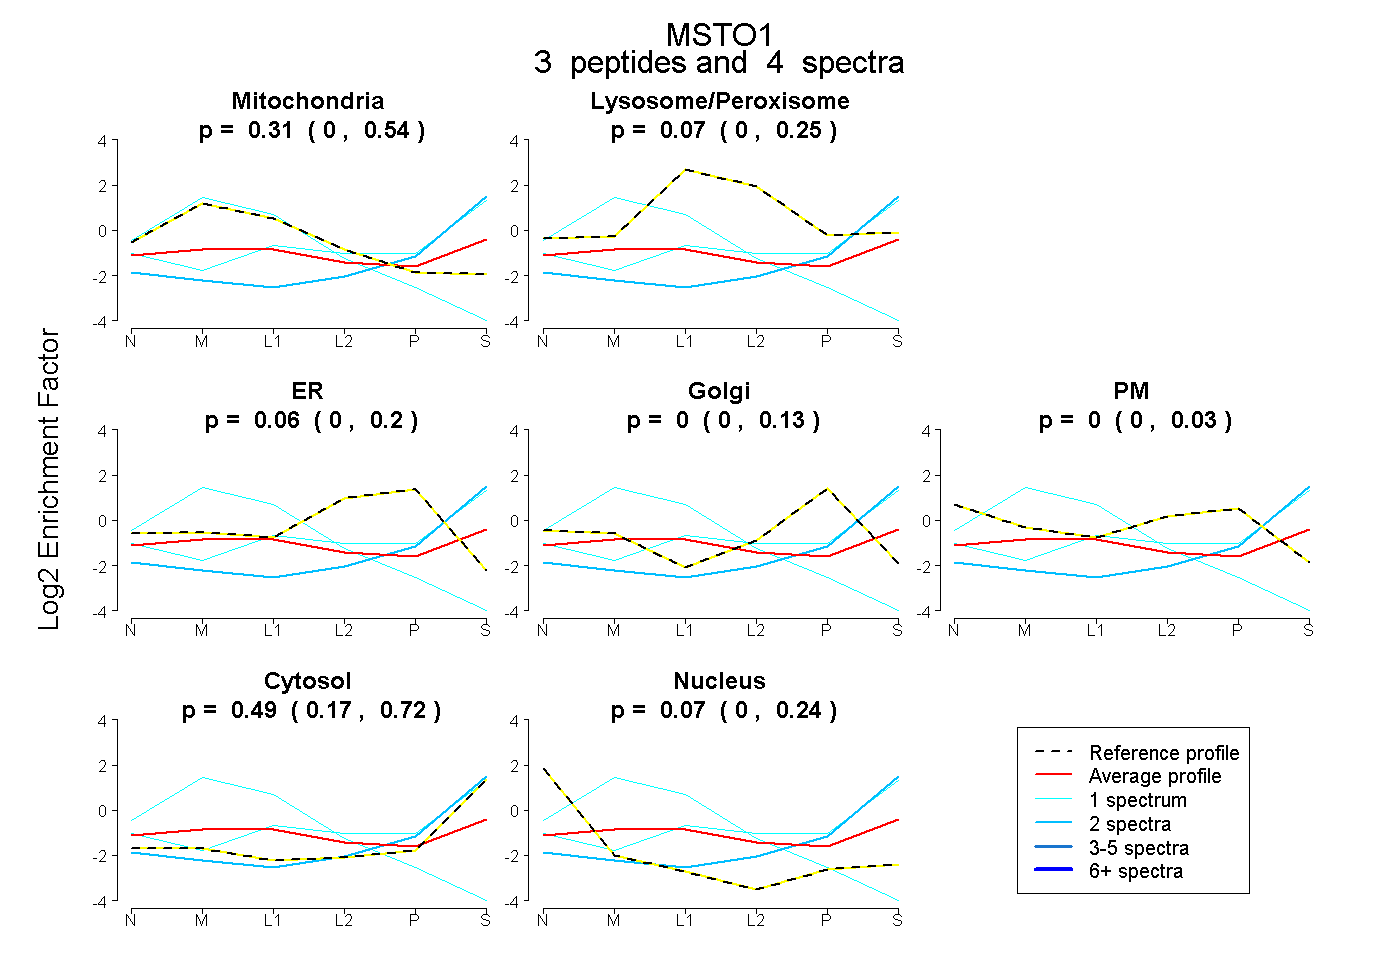
0.000 | 0.542
0.000 | 0.246
0.000 | 0.200
0.000 | 0.128
0.000 | 0.031
0.168 | 0.717
0.000 | 0.240
3peptides
spectra
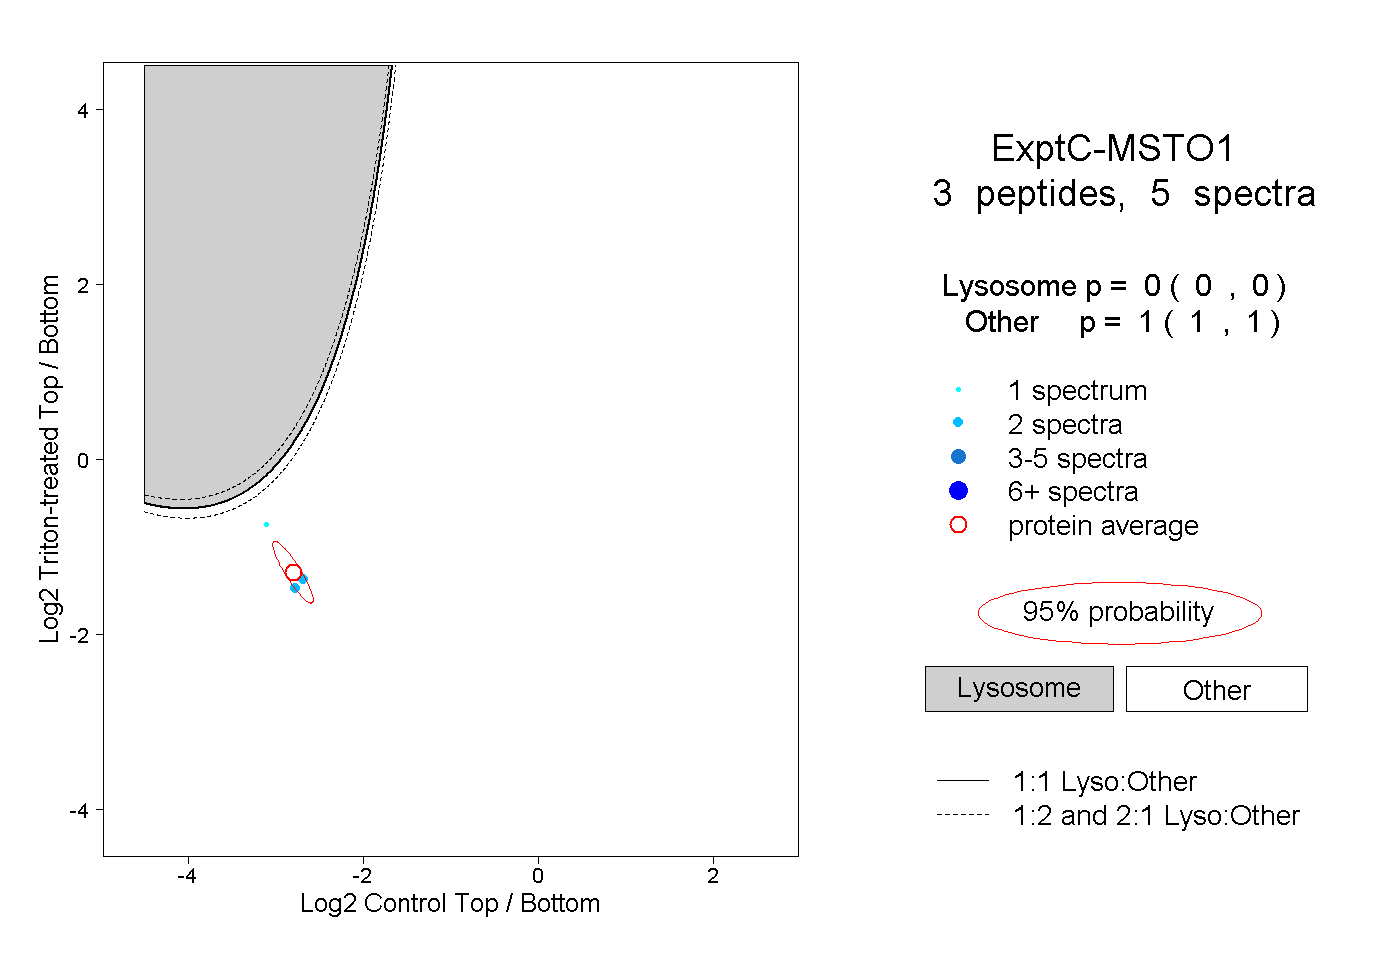
0.000 | 0.000
1.000 | 1.000
1peptide
spectra

NA | NA
NA | NA