 4
4peptides
spectra
0.000 | 0.055
0.000 | 0.081
0.029 | 0.139
0.000 | 0.000
0.000 | 0.067
0.000 | 0.006
0.784 | 0.863
0.000 | 0.000
| Plot | Mito | Lyso | Perox | ER | Golgi | PM | Cytosol | Nucleus | |||||
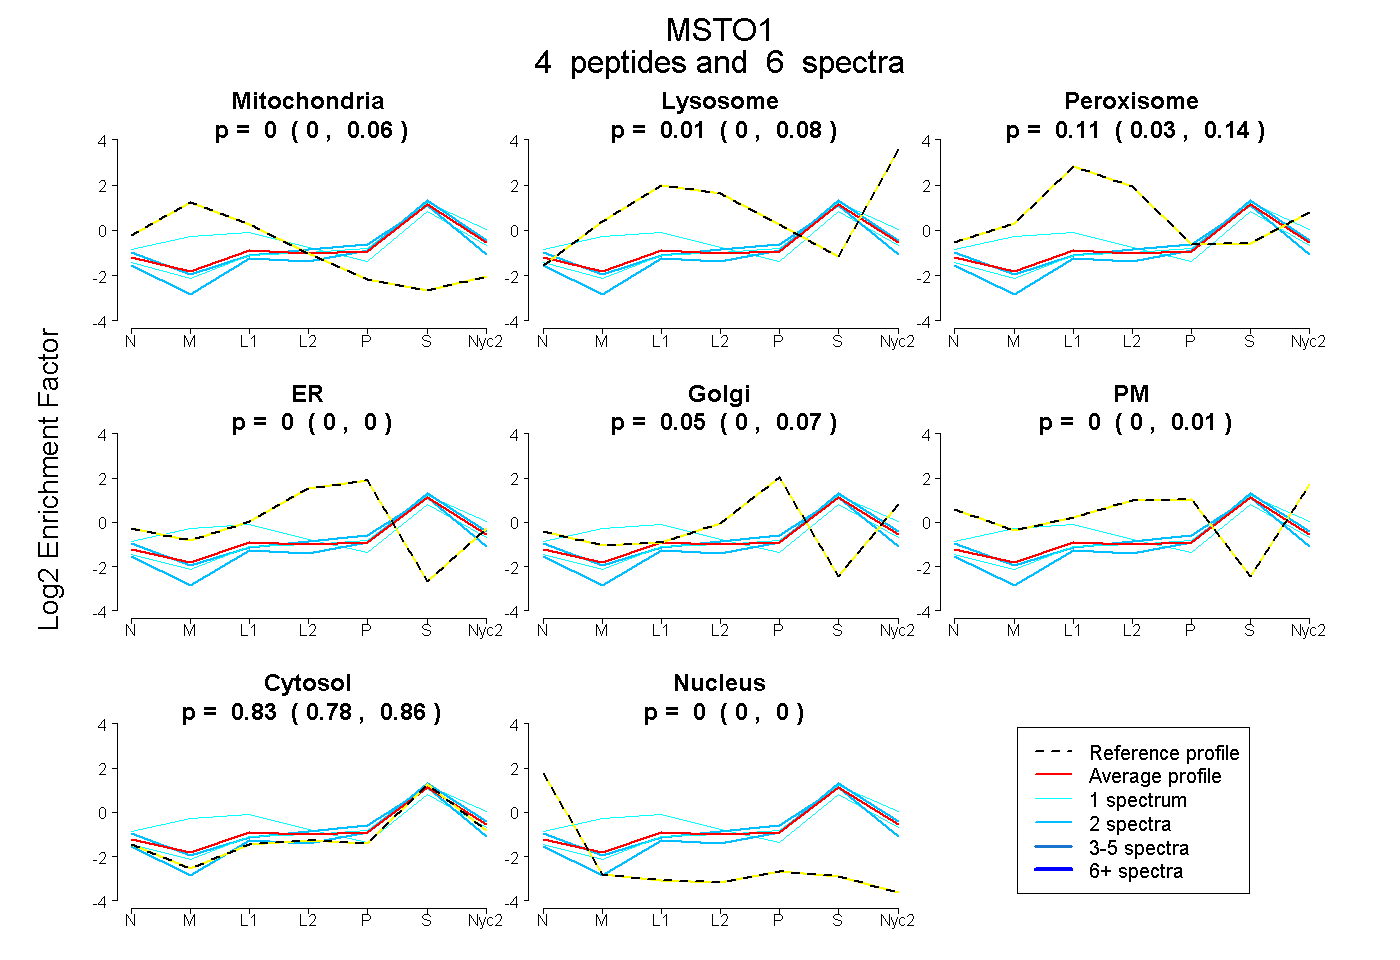
| Expt A |
4 peptides |
6 spectra |
|
0.001 0.000 | 0.055 |
0.009 0.000 | 0.081 |
0.114 0.029 | 0.139 |
0.000 0.000 | 0.000 |
0.046 0.000 | 0.067 |
0.000 0.000 | 0.006 |
0.830 0.784 | 0.863 |
0.000 0.000 | 0.000 |
| 1 spectrum, TAELLQDEYSGR | 0.000 | 0.138 | 0.000 | 0.000 | 0.008 | 0.000 | 0.854 | 0.000 | ||
| 2 spectra, SICVIQK | 0.001 | 0.000 | 0.021 | 0.133 | 0.000 | 0.000 | 0.845 | 0.000 | ||
| 2 spectra, YLEELEDR | 0.000 | 0.015 | 0.000 | 0.000 | 0.032 | 0.000 | 0.954 | 0.000 | ||
| 1 spectrum, GAAVQSIPVFGALR | 0.204 | 0.000 | 0.234 | 0.000 | 0.000 | 0.000 | 0.562 | 0.000 |
| Plot | Mito | Lyso or Perox | ER | Golgi | PM | Cytosol | Nucleus | ||||||
| Expt B |
3 peptides |
4 spectra |
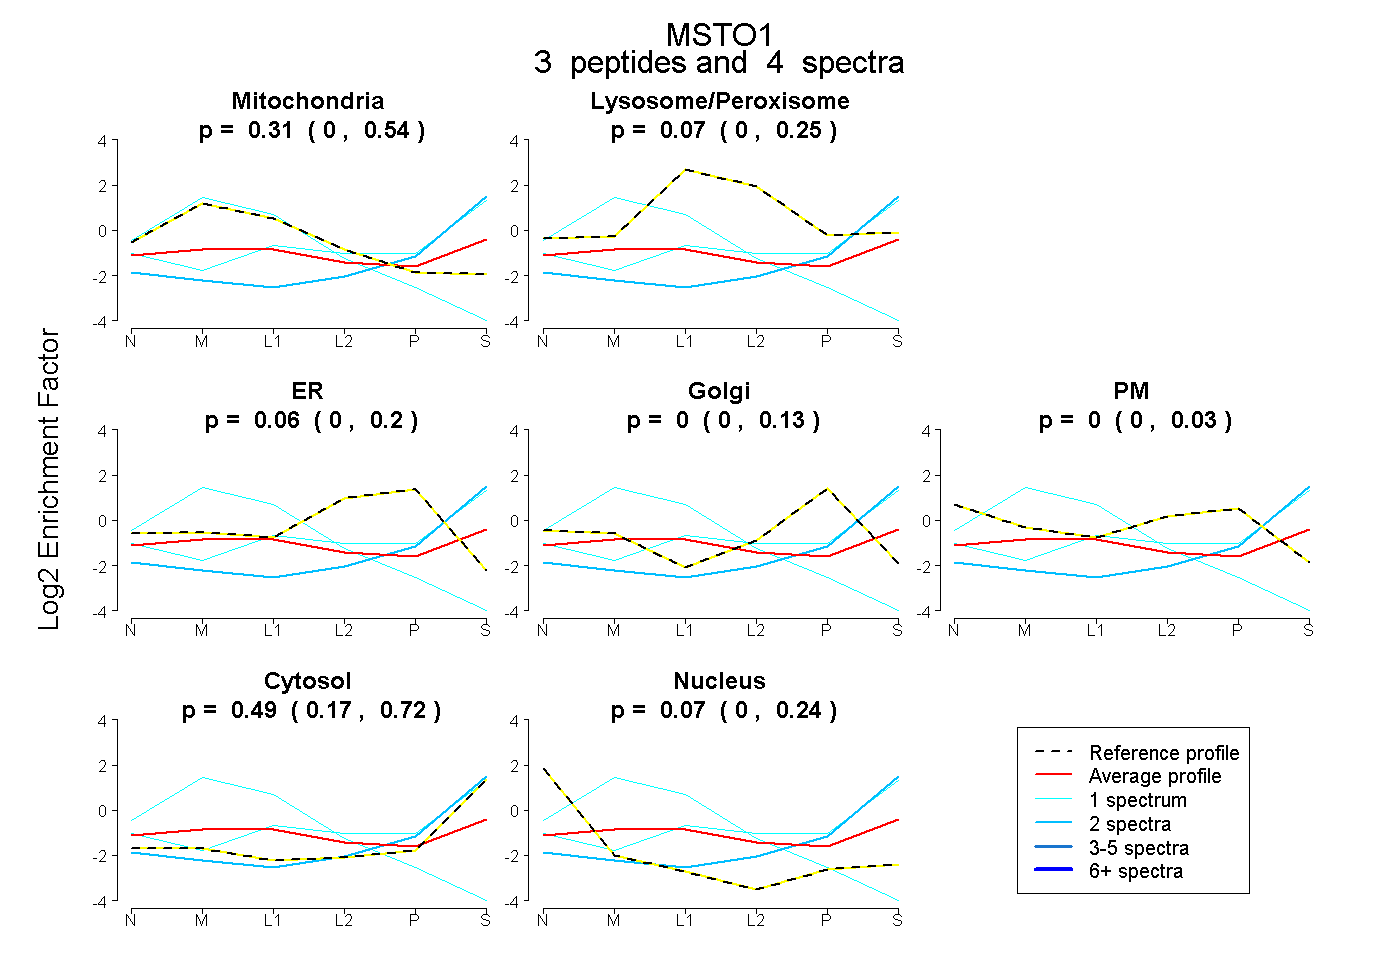 |
0.310 0.000 | 0.542 |
0.070 0.000 | 0.246 |
0.057 0.000 | 0.200 |
0.000 0.000 | 0.128 |
0.000 0.000 | 0.031 |
0.490 0.168 | 0.717 |
0.073 0.000 | 0.240 |
|||
| Plot | Lyso | Other | |||||||||||
| Expt C |
3 peptides |
5 spectra |
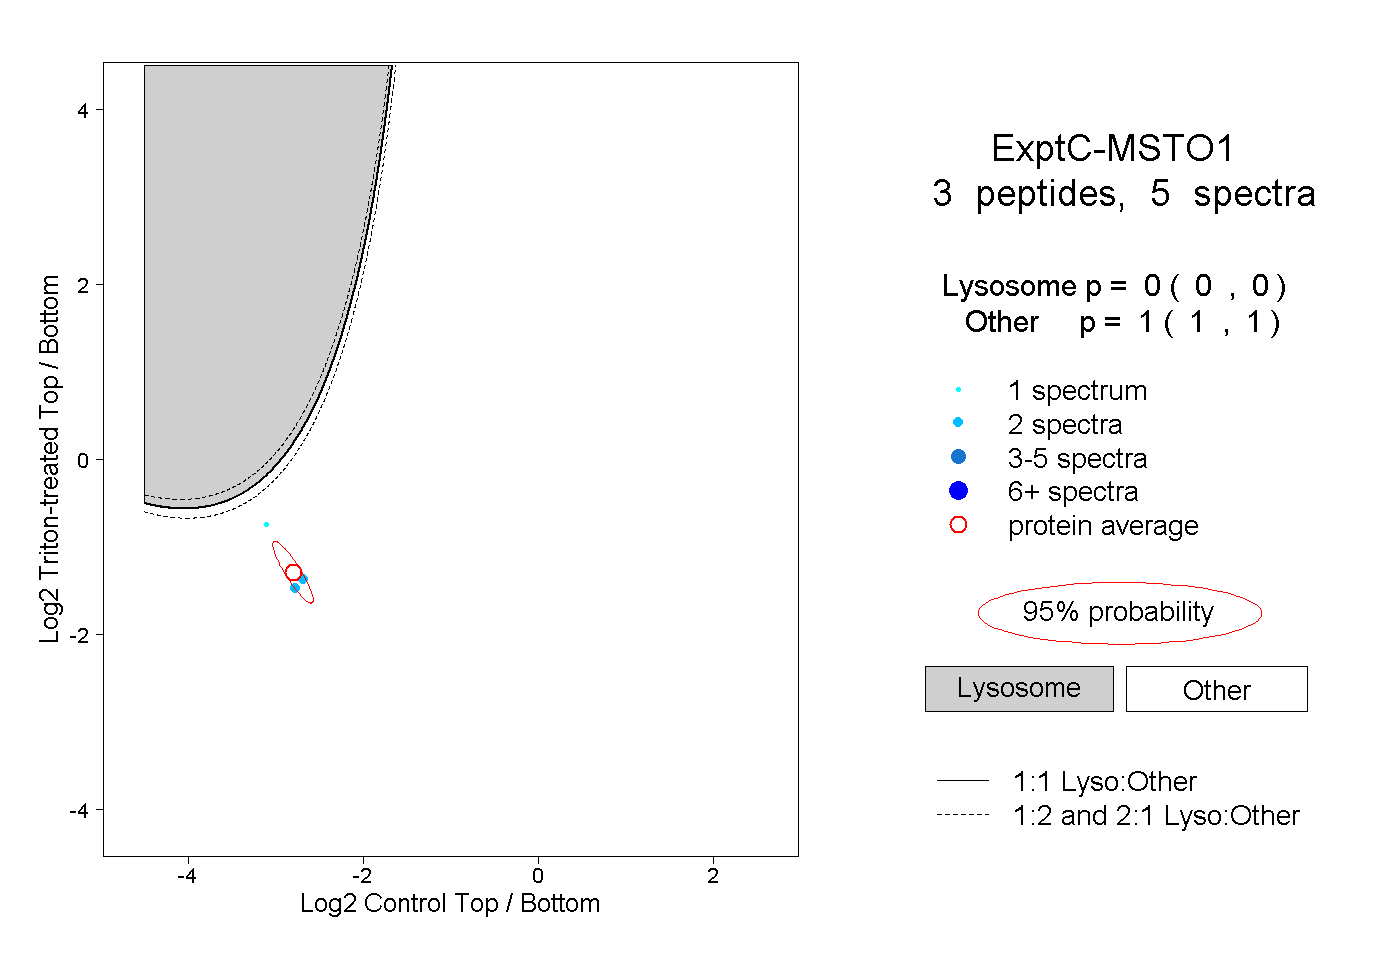 |
0.000 0.000 | 0.000 |
1.000 1.000 | 1.000 |
||||||||
| Plot | Lyso | Other | |||||||||||
| Expt D |
1 peptide |
2 spectra |
 |
0.000 NA | NA |
1.000 NA | NA |