 15
15peptides
spectra
0.000 | 0.000
0.000 | 0.000
0.000 | 0.000
0.086 | 0.208
0.093 | 0.223
0.000 | 0.000
0.177 | 0.204
0.476 | 0.507
1peptide
spectra
0.000 | 0.000
1.000 | 1.000
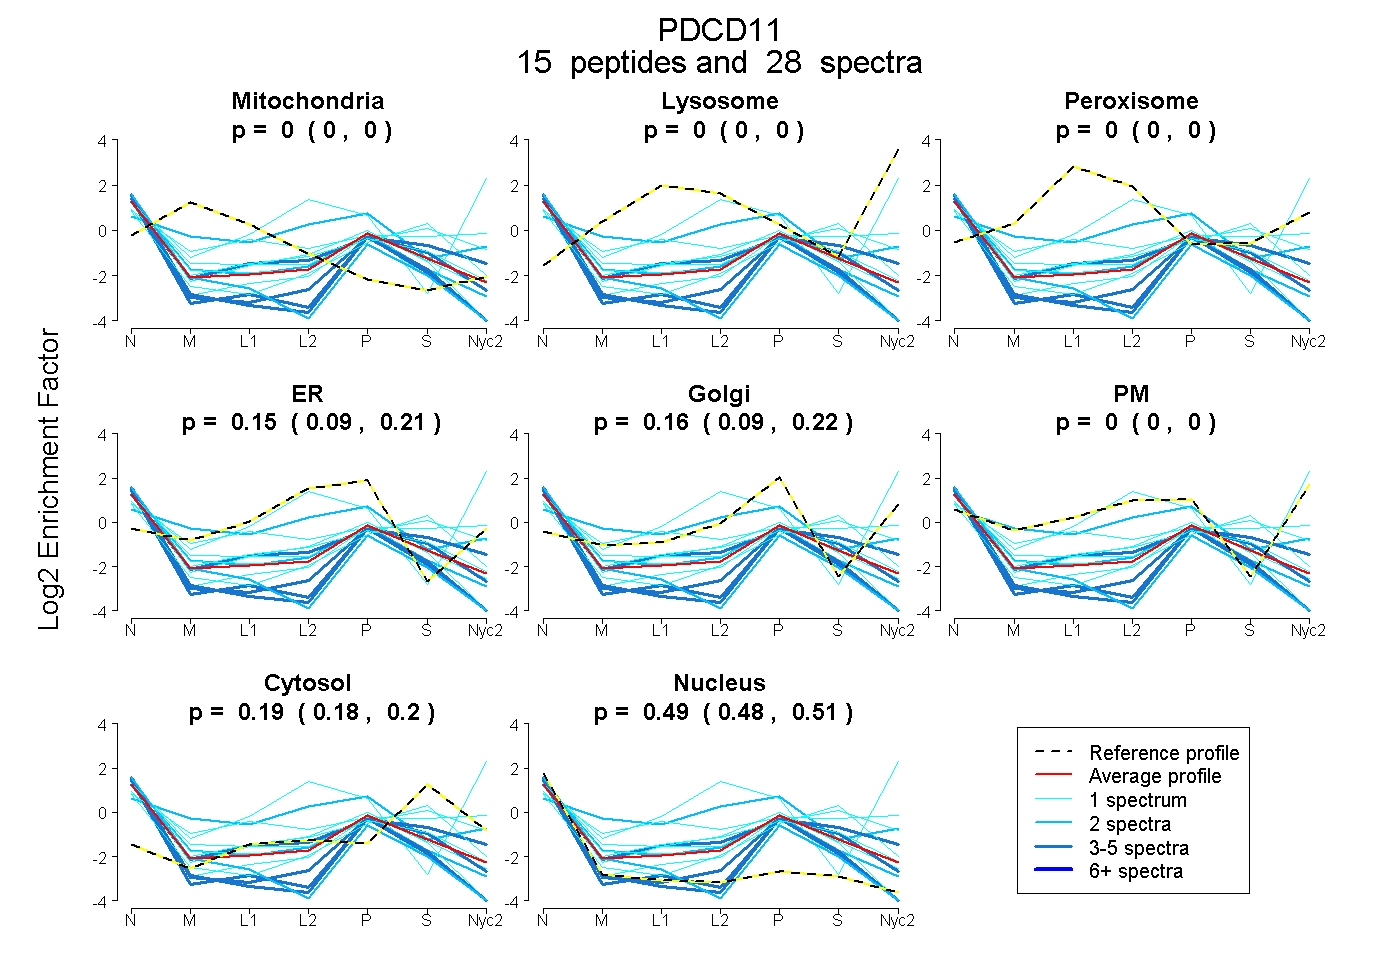
| Plot | Mito | Lyso | Perox | ER | Golgi | PM | Cytosol | Nucleus | |||||
| Expt A |
15 peptides |
28 spectra |
|
0.000 0.000 | 0.000 |
0.000 0.000 | 0.000 |
0.000 0.000 | 0.000 |
0.154 0.086 | 0.208 |
0.162 0.093 | 0.223 |
0.000 0.000 | 0.000 |
0.192 0.177 | 0.204 |
0.492 0.476 | 0.507 |
||
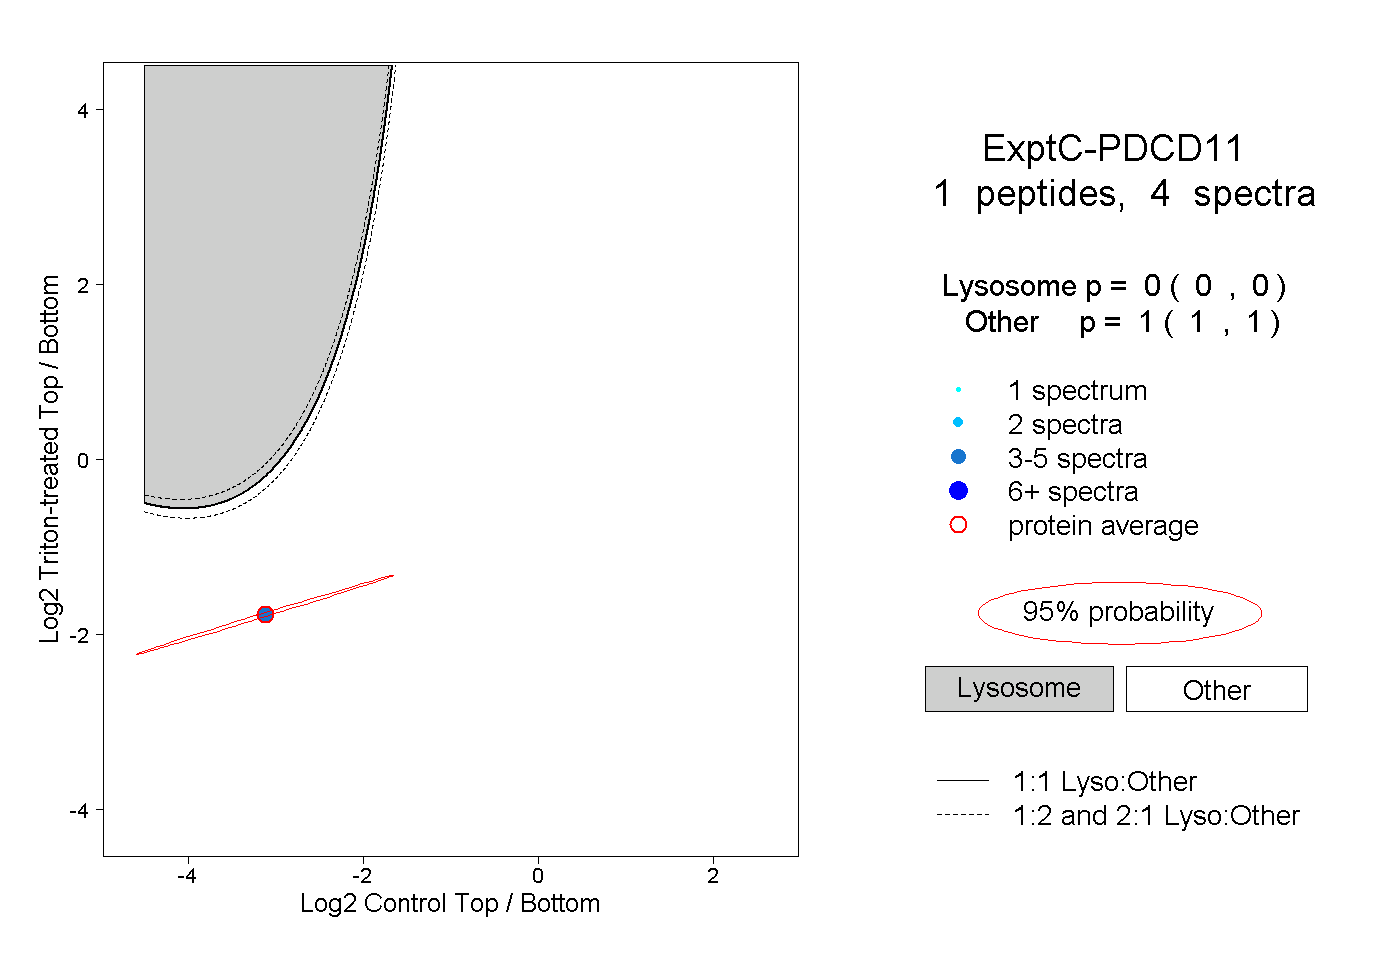
| Plot | Lyso | Other | |||||||||||
| Expt C |
1 peptide |
4 spectra |
|
0.000 0.000 | 0.000 |
1.000 1.000 | 1.000 |