 6
6peptides
spectra
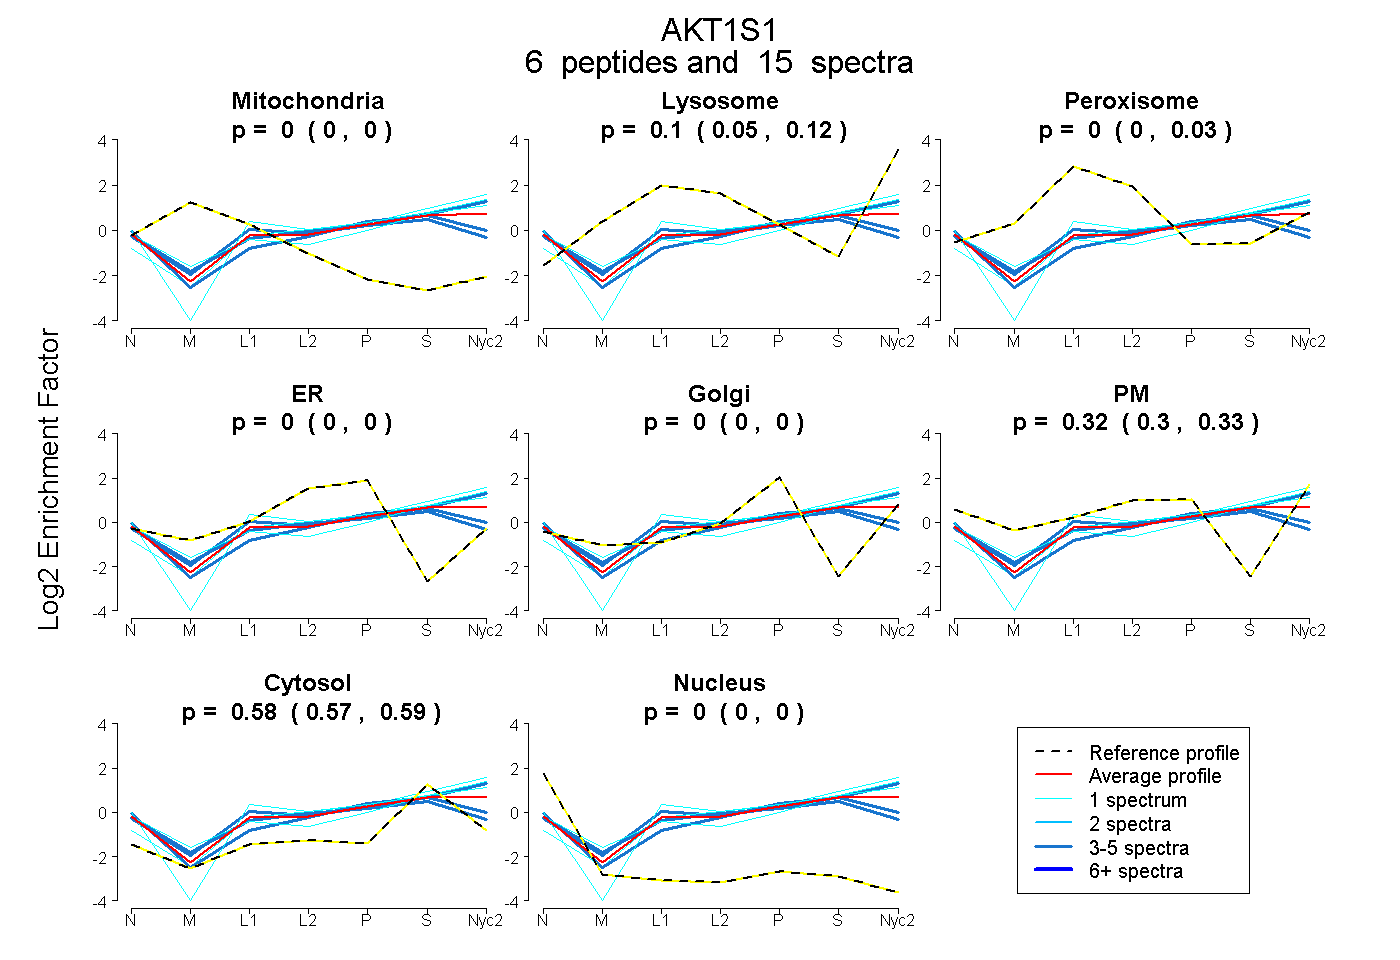
0.000 | 0.000
0.053 | 0.121
0.000 | 0.031
0.000 | 0.000
0.000 | 0.000
0.299 | 0.332
0.569 | 0.594
0.000 | 0.000
2peptides
spectra
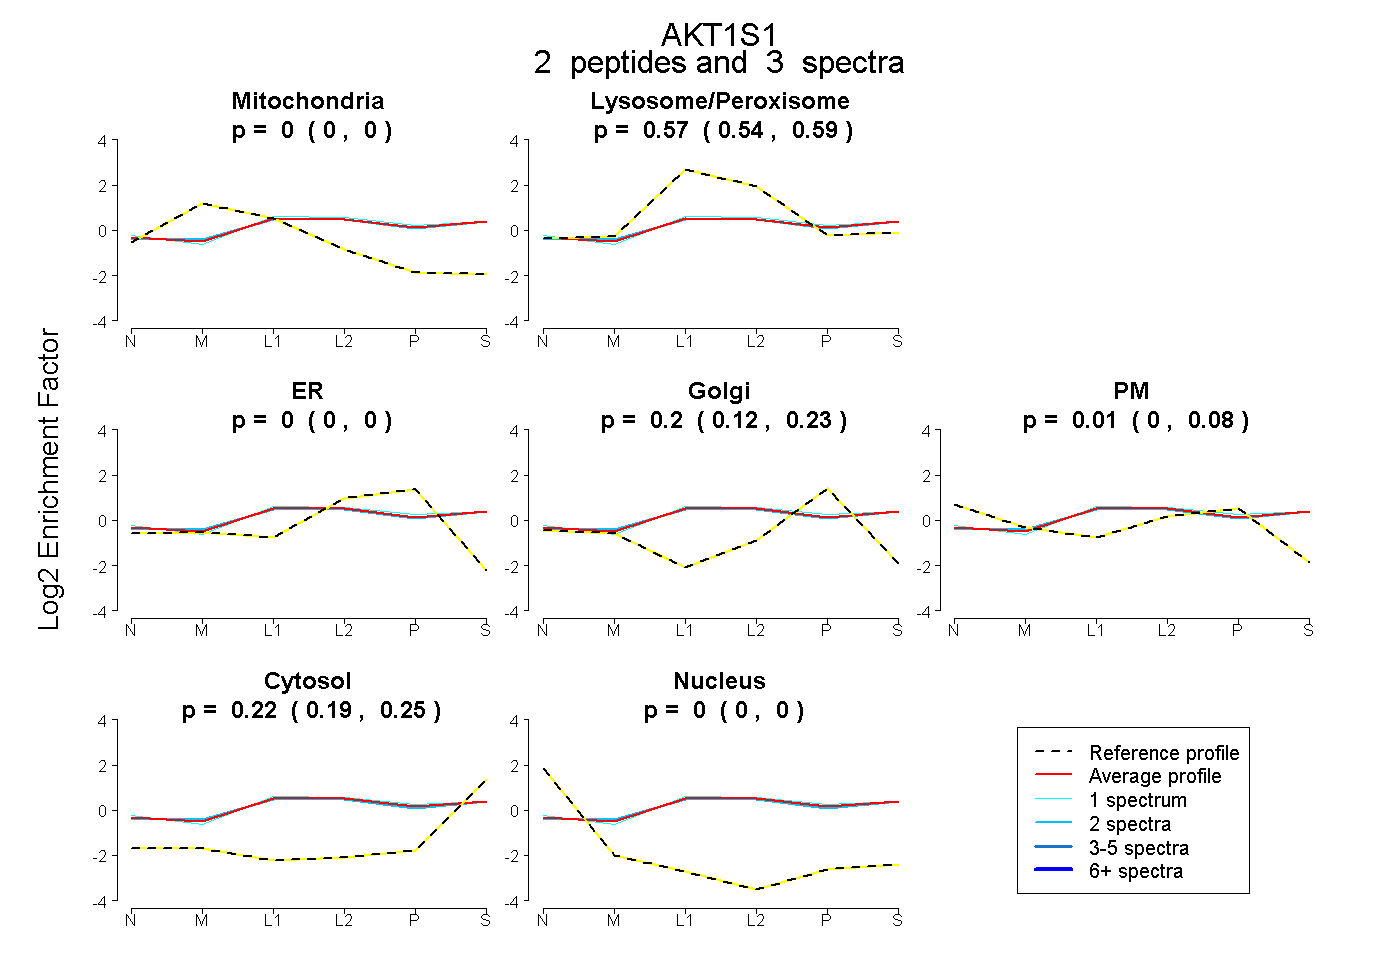
0.000 | 0.000
0.540 | 0.587
0.000 | 0.000
0.116 | 0.230
0.000 | 0.078
0.192 | 0.249
0.000 | 0.000
5peptides
spectra
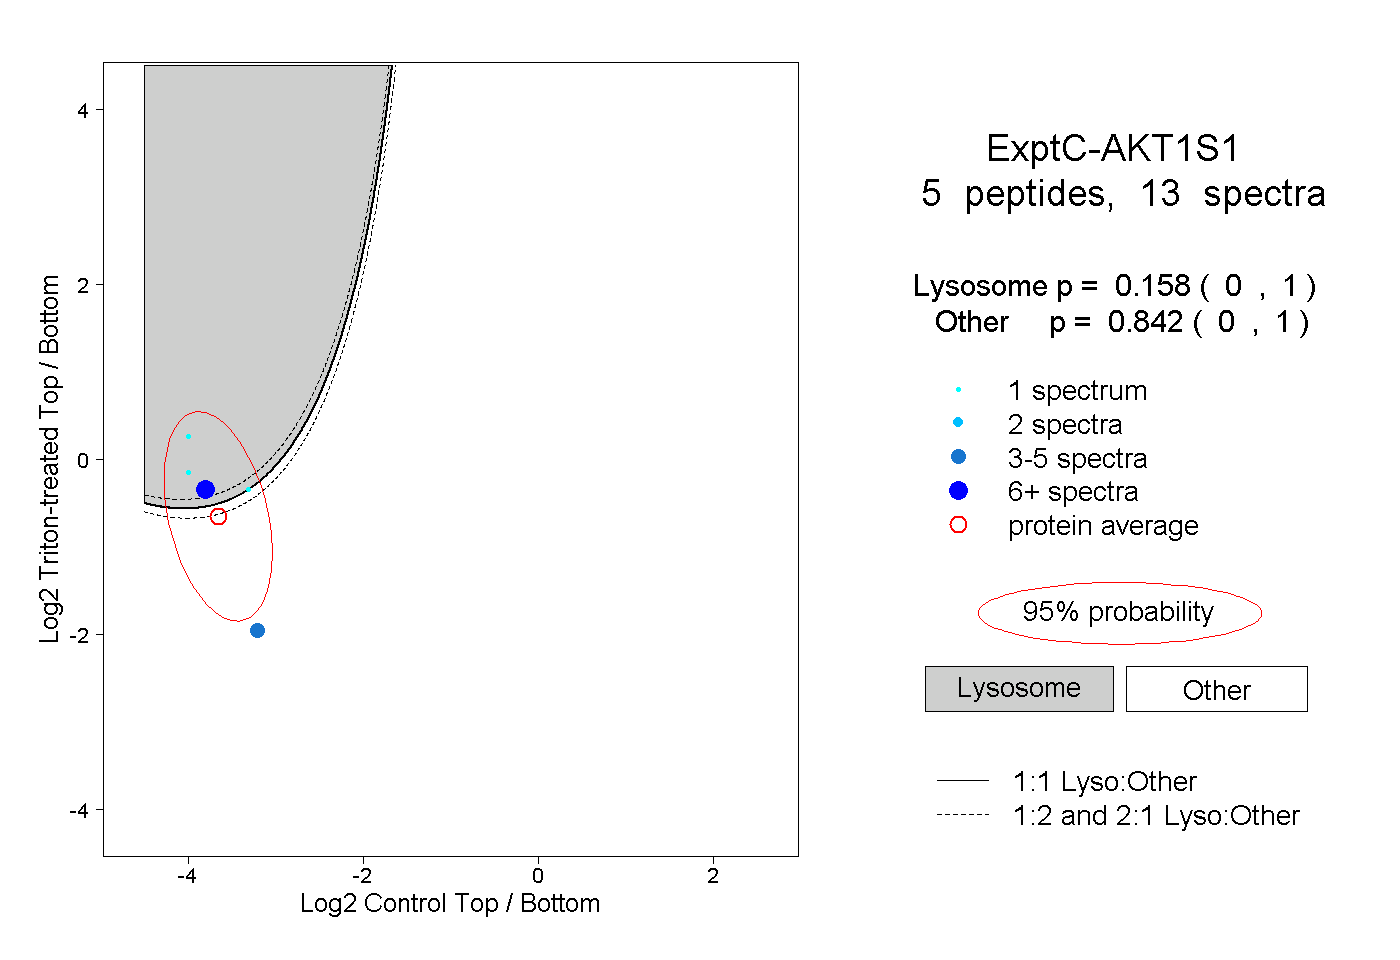
0.000 | 1.000
0.000 | 1.000