 6
6peptides
spectra
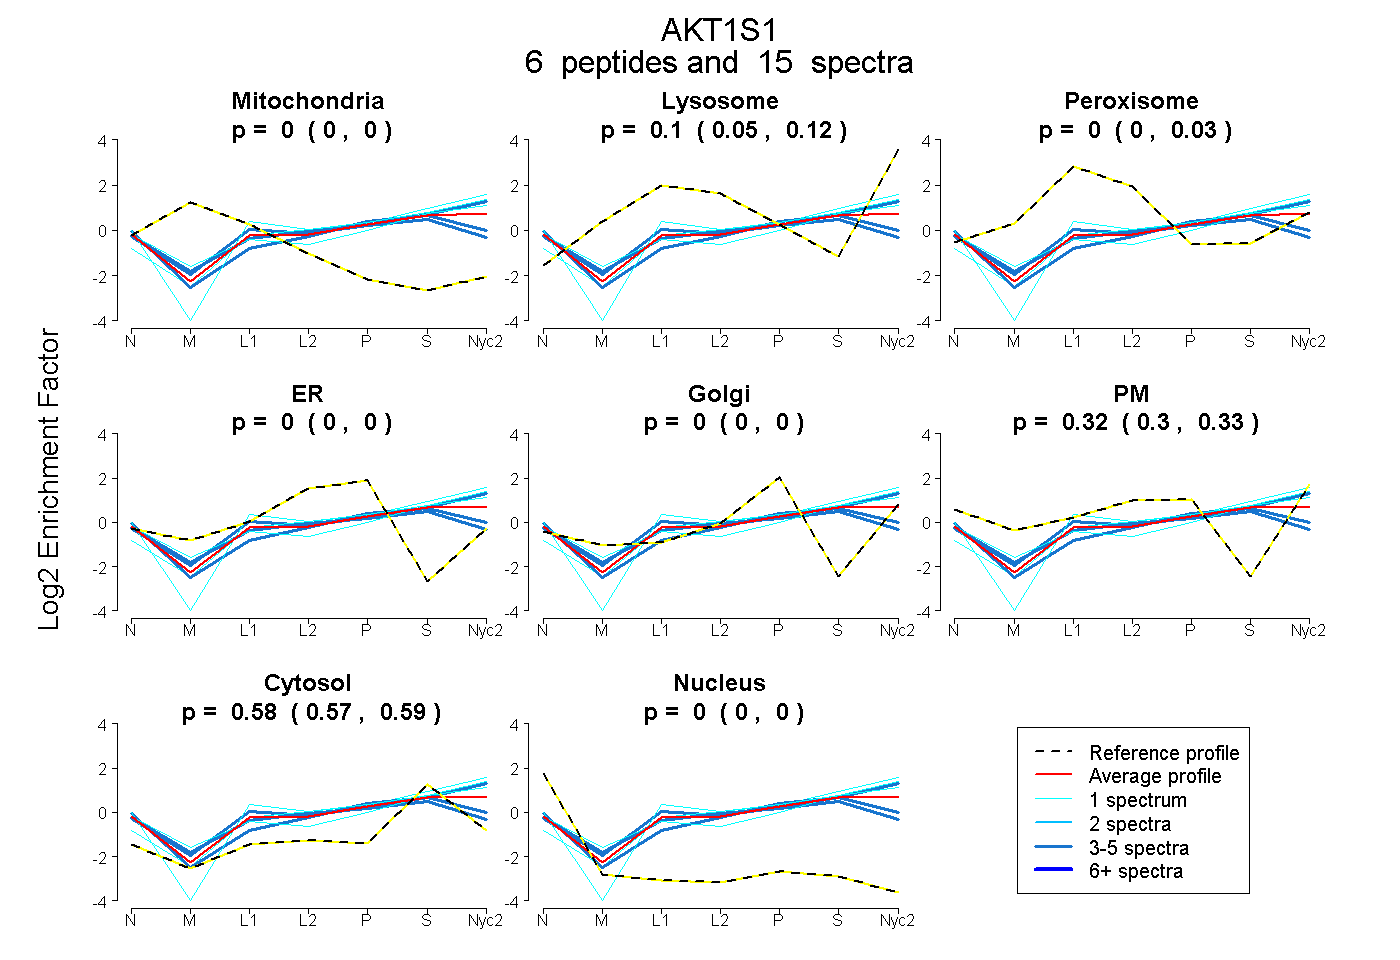
0.000 | 0.000
0.053 | 0.121
0.000 | 0.031
0.000 | 0.000
0.000 | 0.000
0.299 | 0.332
0.569 | 0.594
0.000 | 0.000
| Plot | Mito | Lyso | Perox | ER | Golgi | PM | Cytosol | Nucleus | |||||
| Expt A |
6 peptides |
15 spectra |
|
0.000 0.000 | 0.000 |
0.098 0.053 | 0.121 |
0.000 0.000 | 0.031 |
0.000 0.000 | 0.000 |
0.000 0.000 | 0.000 |
0.317 0.299 | 0.332 |
0.584 0.569 | 0.594 |
0.000 0.000 | 0.000 |
| 1 spectrum, SLPVSVPVWAFK | 0.000 | 0.145 | 0.000 | 0.000 | 0.000 | 0.260 | 0.595 | 0.000 | ||
| 1 spectrum, LNTSDFQK | 0.000 | 0.162 | 0.000 | 0.000 | 0.000 | 0.256 | 0.582 | 0.000 | ||
| 1 spectrum, IAASMR | 0.000 | 0.340 | 0.000 | 0.000 | 0.099 | 0.000 | 0.560 | 0.000 | ||
| 3 spectra, CLHDIAQAHR | 0.000 | 0.000 | 0.097 | 0.204 | 0.000 | 0.121 | 0.579 | 0.000 | ||
| 4 spectra, EAEDNQVFGDLPRPR | 0.000 | 0.244 | 0.000 | 0.000 | 0.000 | 0.227 | 0.529 | 0.000 | ||
| 5 spectra, LAAMAR | 0.000 | 0.000 | 0.000 | 0.073 | 0.067 | 0.228 | 0.633 | 0.000 |
| Plot | Mito | Lyso or Perox | ER | Golgi | PM | Cytosol | Nucleus | ||||||
| Expt B |
2 peptides |
3 spectra |
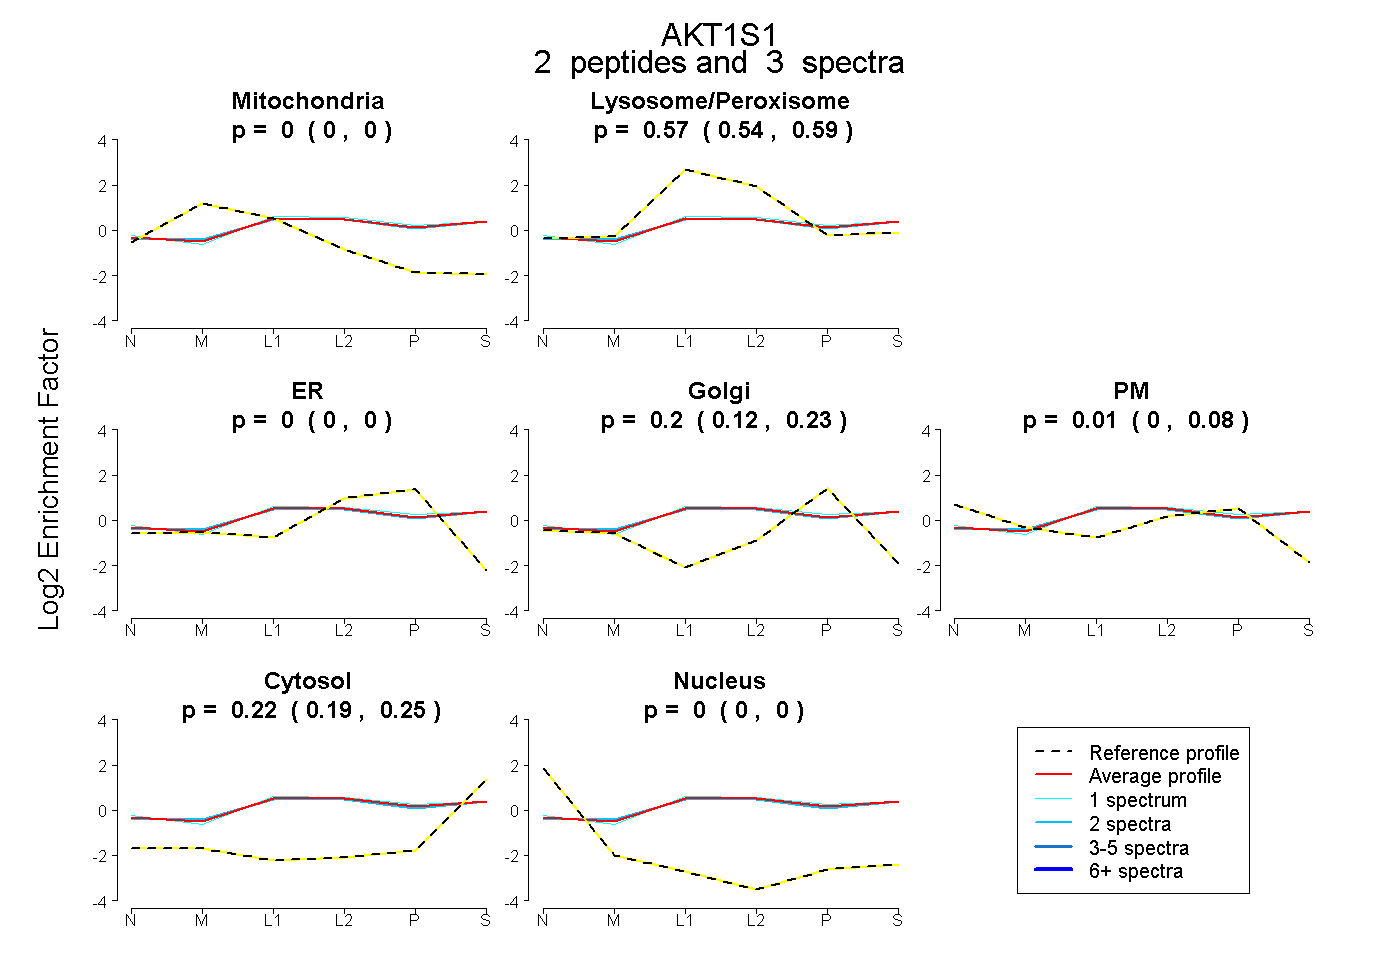 |
0.000 0.000 | 0.000 |
0.570 0.540 | 0.587 |
0.000 0.000 | 0.000 |
0.199 0.116 | 0.230 |
0.009 0.000 | 0.078 |
0.222 0.192 | 0.249 |
0.000 0.000 | 0.000 |
|||
| Plot | Lyso | Other | |||||||||||
| Expt C |
5 peptides |
13 spectra |
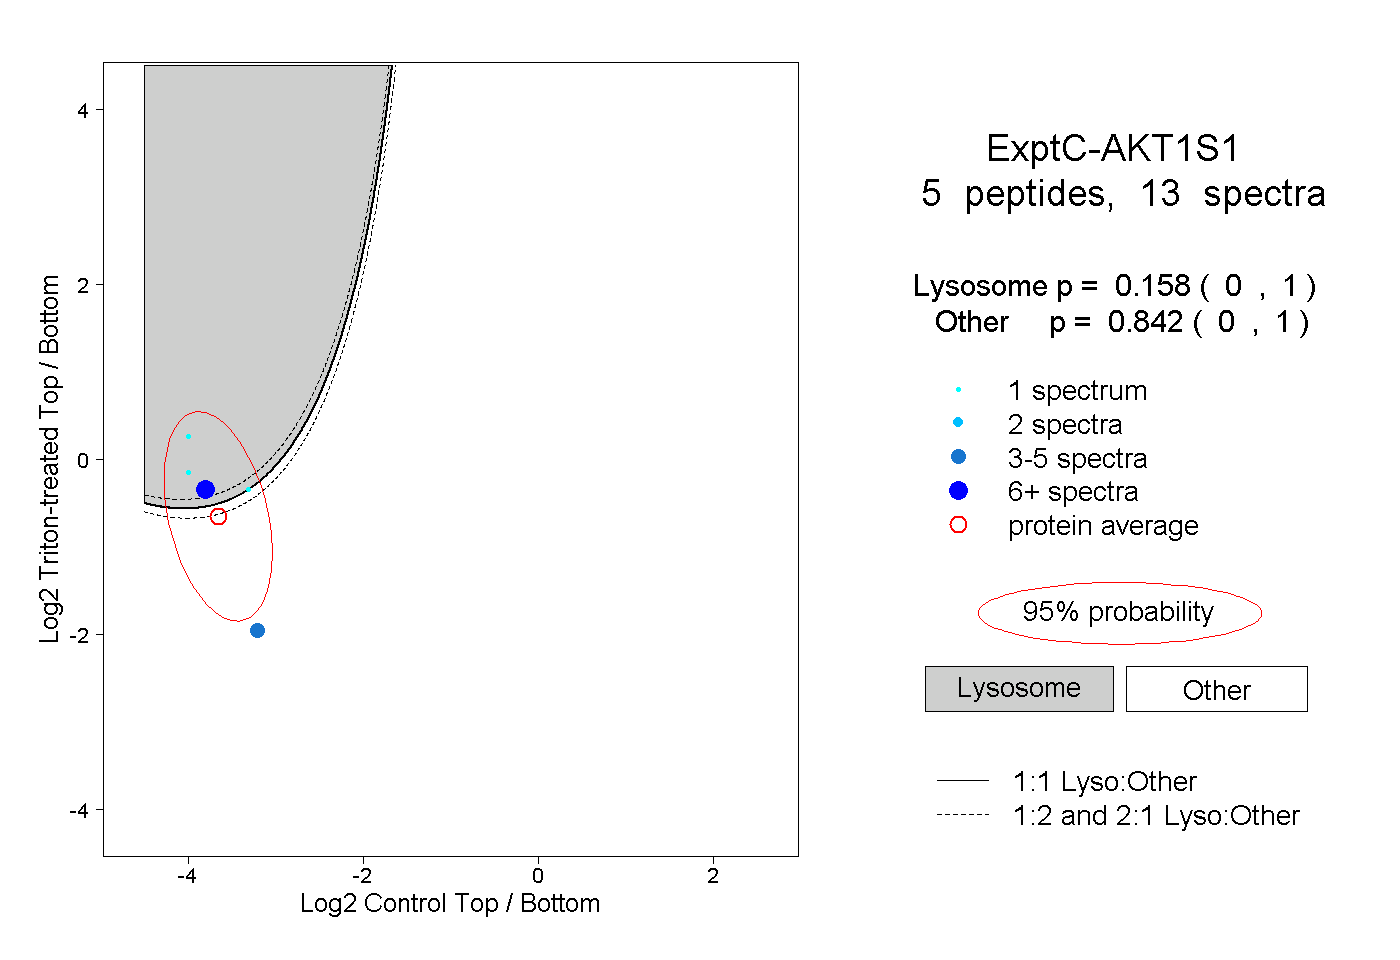 |
0.158 0.000 | 1.000 |
0.842 0.000 | 1.000 |