 4
4peptides
spectra
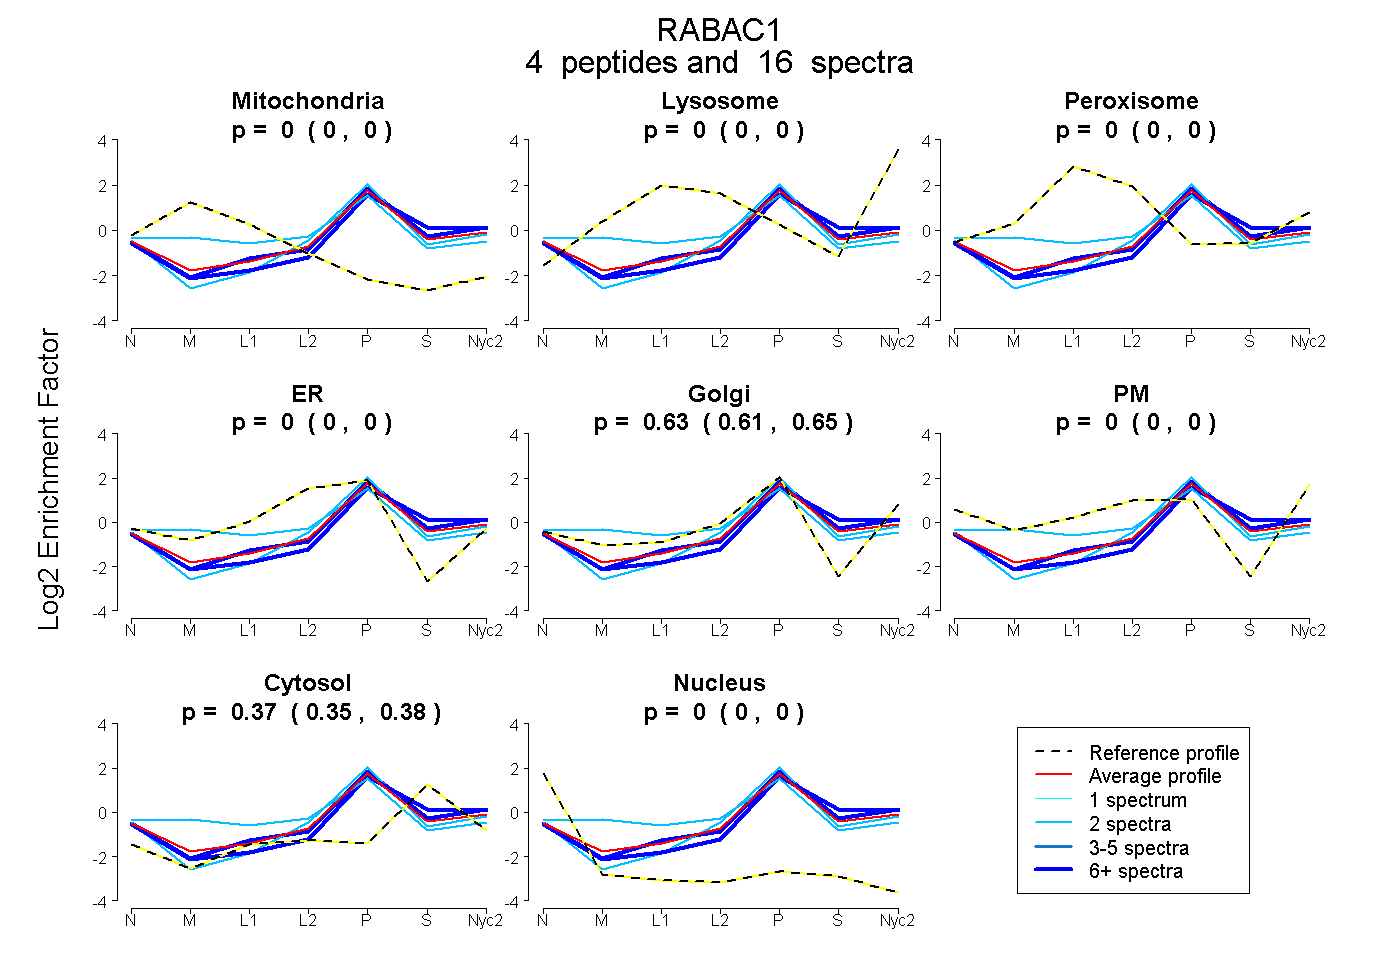
0.000 | 0.000
0.000 | 0.000
0.000 | 0.000
0.000 | 0.000
0.614 | 0.646
0.000 | 0.000
0.351 | 0.384
0.000 | 0.000
2peptides
spectra
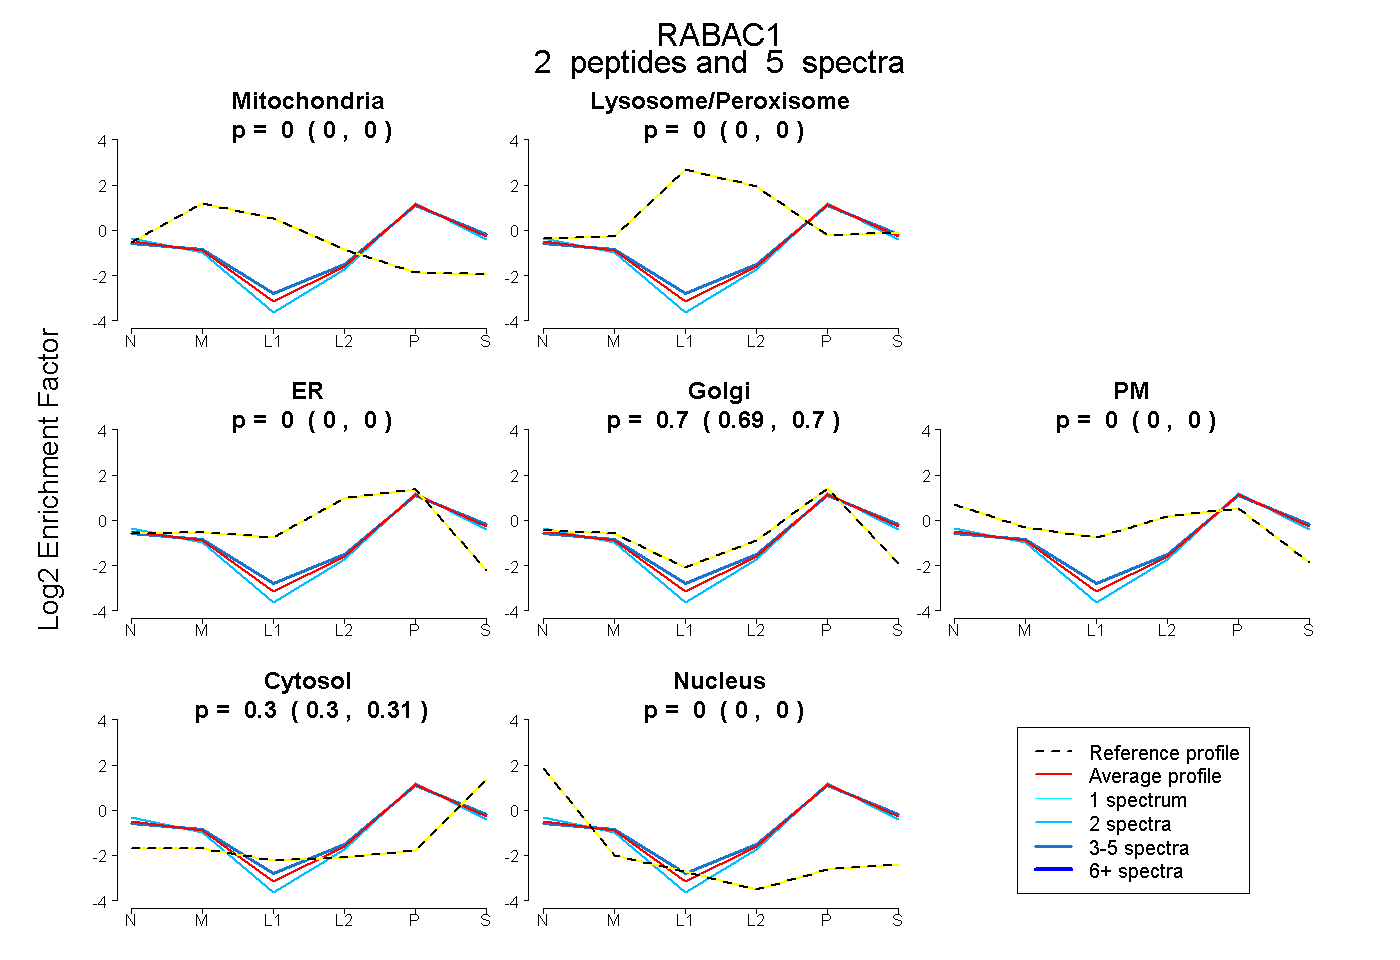
0.000 | 0.000
0.000 | 0.000
0.000 | 0.000
0.686 | 0.703
0.000 | 0.000
0.296 | 0.313
0.000 | 0.000
3peptides
spectra
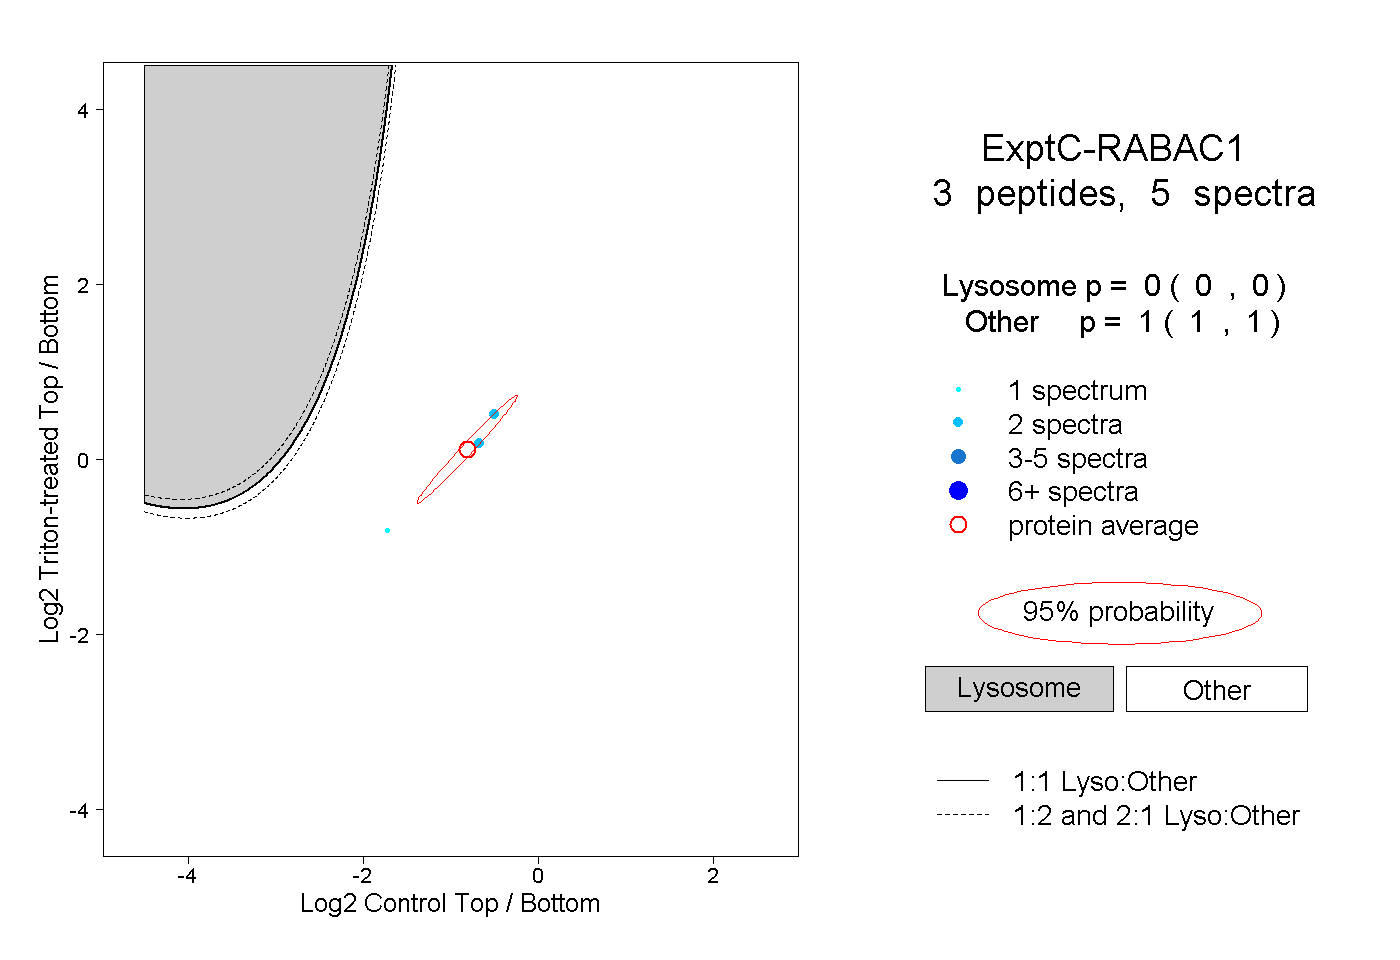
0.000 | 0.000
1.000 | 1.000
1peptide
spectrum
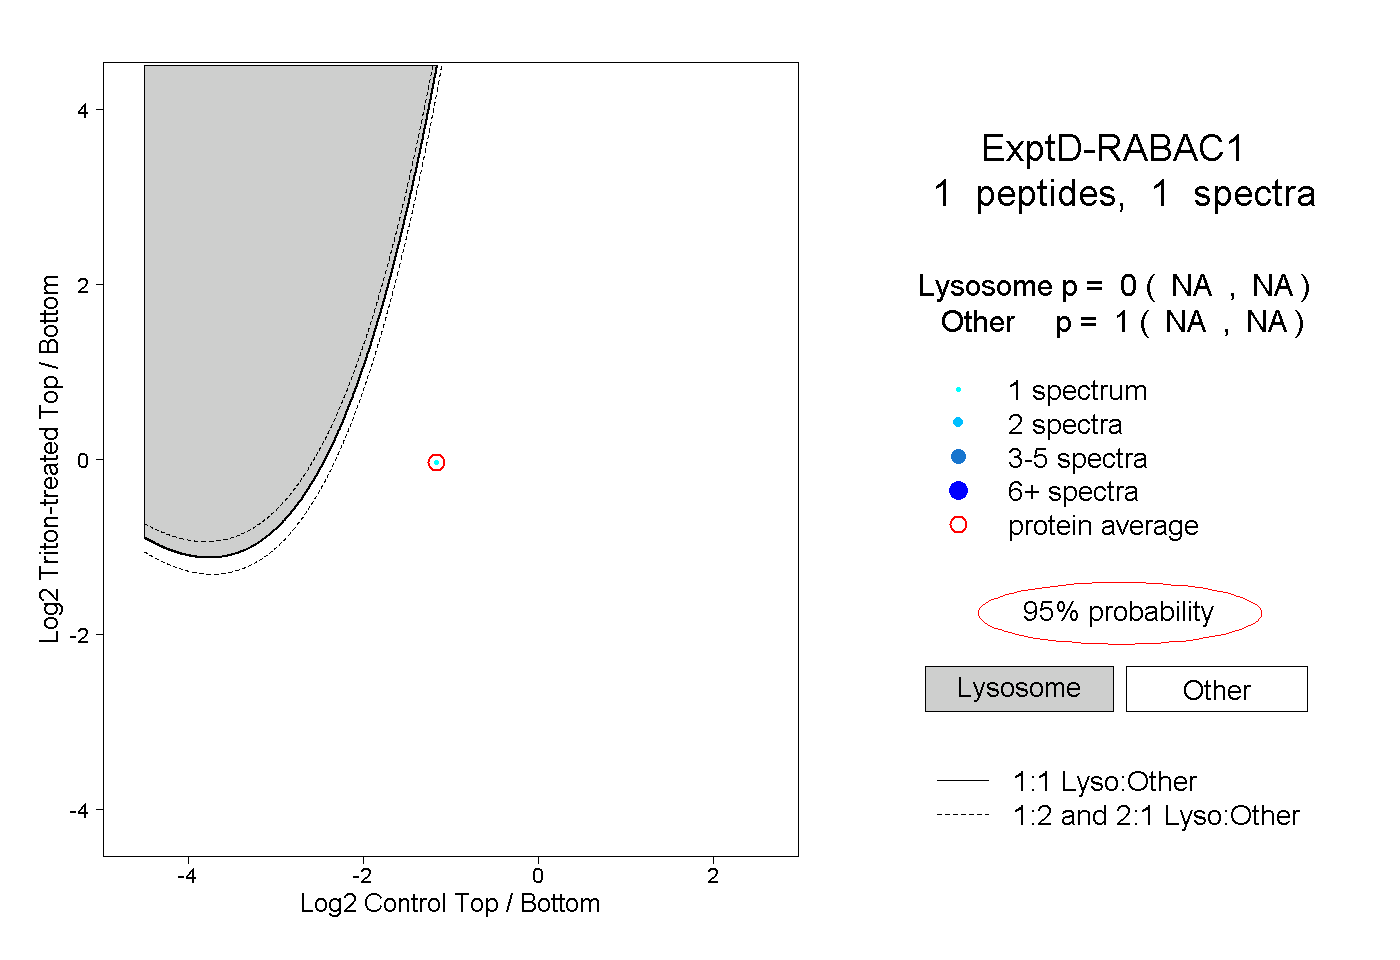
NA | NA
NA | NA