RABAC1
[ENSRNOP00000027435]
Main page
| | | Plot |
Mito |
Lyso |
|
Perox |
ER |
Golgi |
PM |
Cytosol |
Nucleus |
|
| Expt A |
 4
4
peptides |
16
spectra |
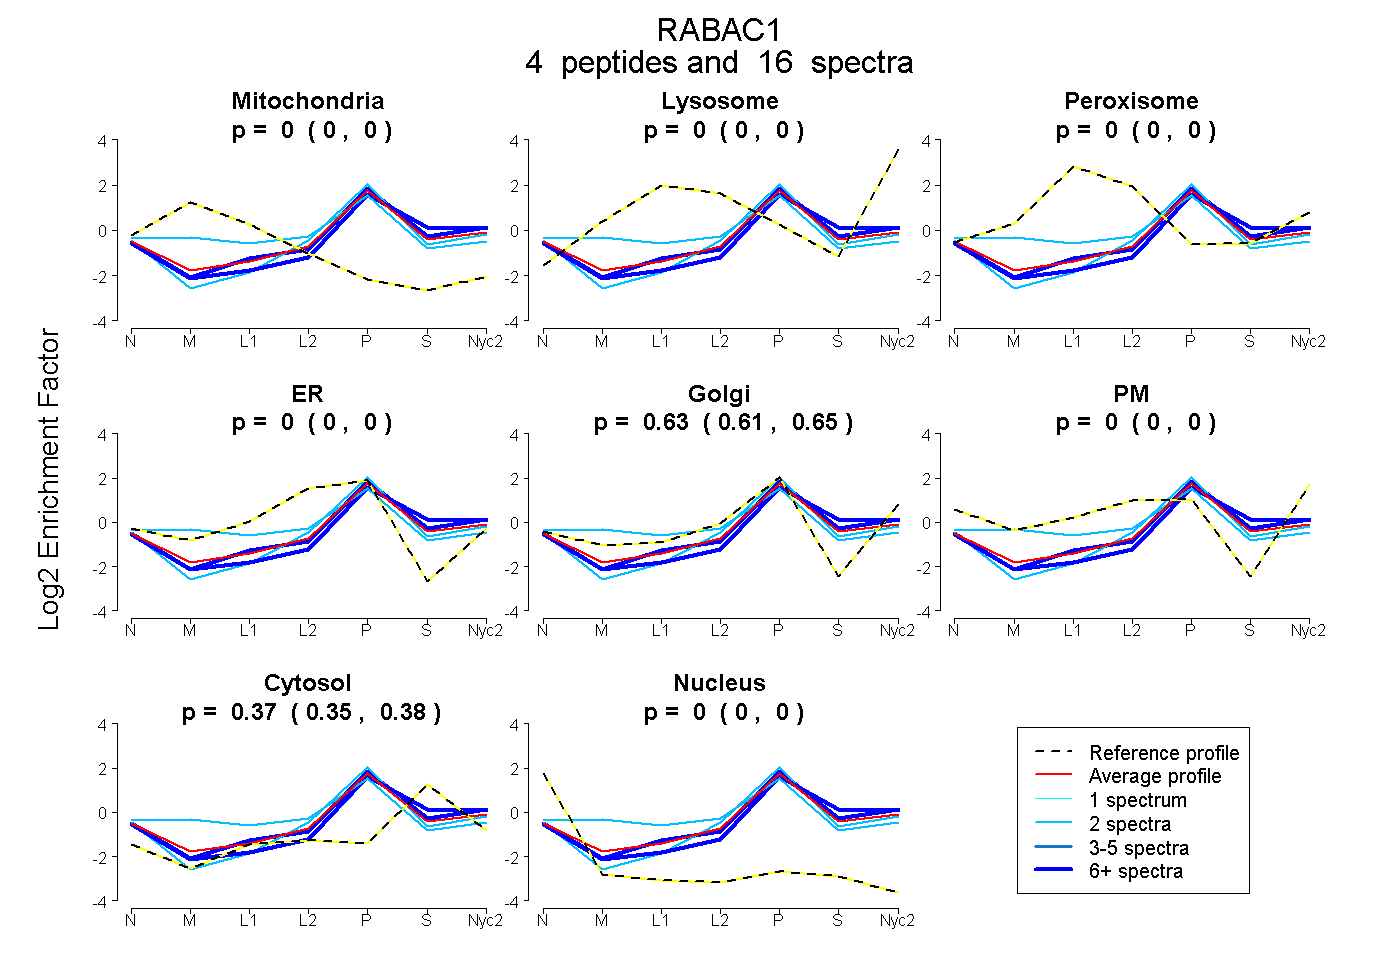 |
0.000
0.000 | 0.000 |
0.000
0.000 | 0.000 |
|
0.000
0.000 | 0.000 |
0.000
0.000 | 0.000 |
0.631
0.614 | 0.646 |
0.000
0.000 | 0.000 |
0.369
0.351 | 0.384 |
0.000
0.000 | 0.000 |
|
| | | Plot |
Mito |
|
Lyso or Perox |
|
ER |
Golgi |
PM |
Cytosol |
Nucleus |
|
| Expt B |
2
peptides |
5
spectra |
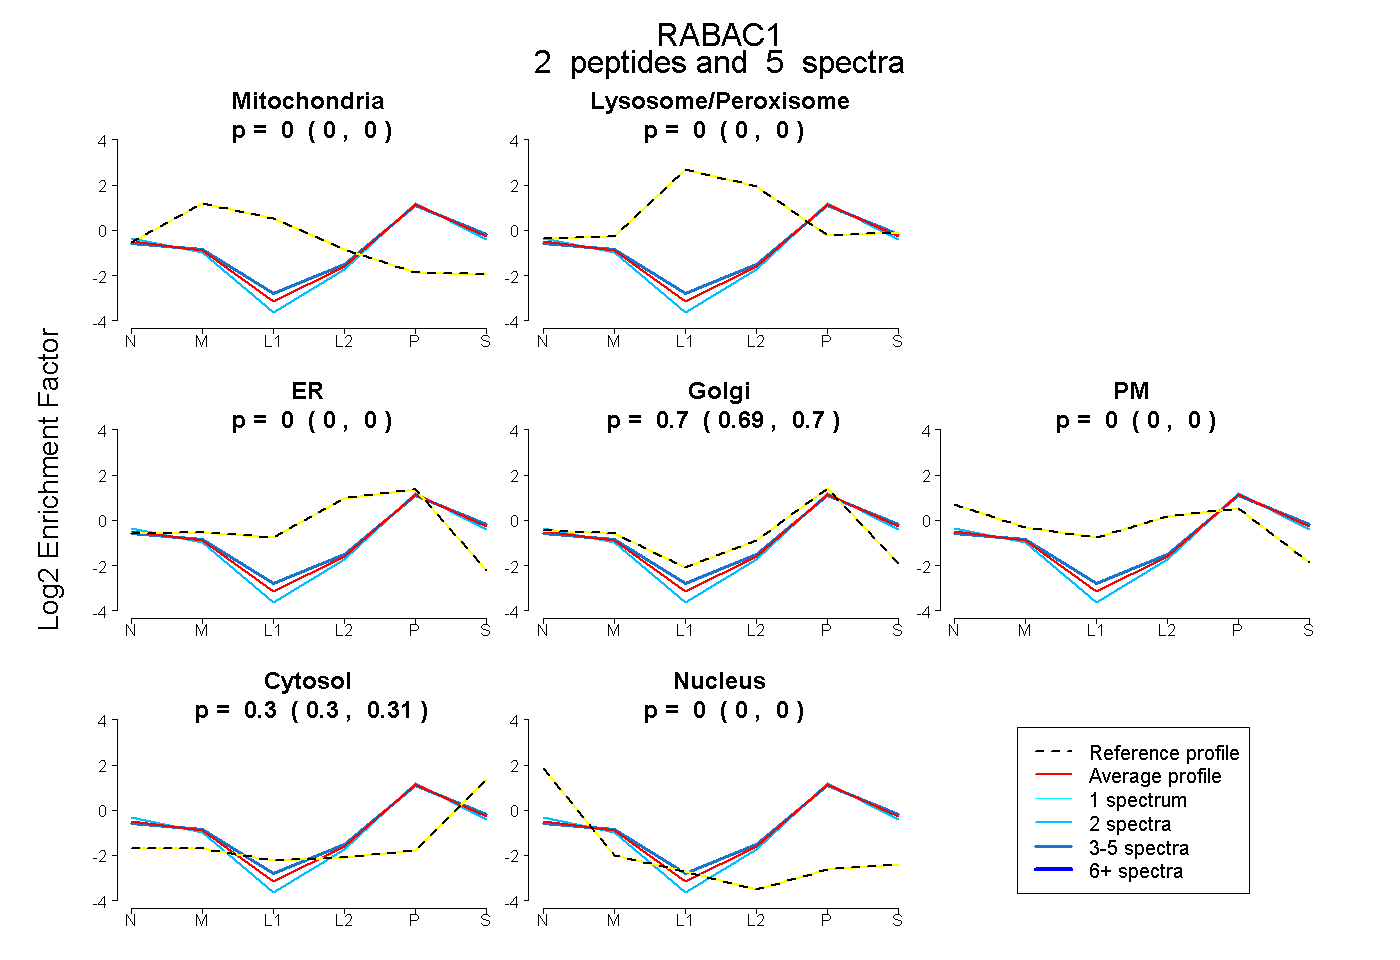 |
0.000
0.000 | 0.000 |
|
0.000
0.000 | 0.000 |
|
0.000
0.000 | 0.000 |
0.695
0.686 | 0.703 |
0.000
0.000 | 0.000 |
0.305
0.296 | 0.313 |
0.000
0.000 | 0.000 |
|
| 3 spectra, LVLFGR |
0.000 |
|
0.000 |
|
0.000 |
0.684 |
0.000 |
0.316 |
0.000 |
|
| 2 spectra, LIPSGAGR |
0.000 |
|
0.000 |
|
0.000 |
0.704 |
0.000 |
0.279 |
0.017 |
|
| | | Plot |
|
Lyso |
|
|
|
|
|
|
|
Other |
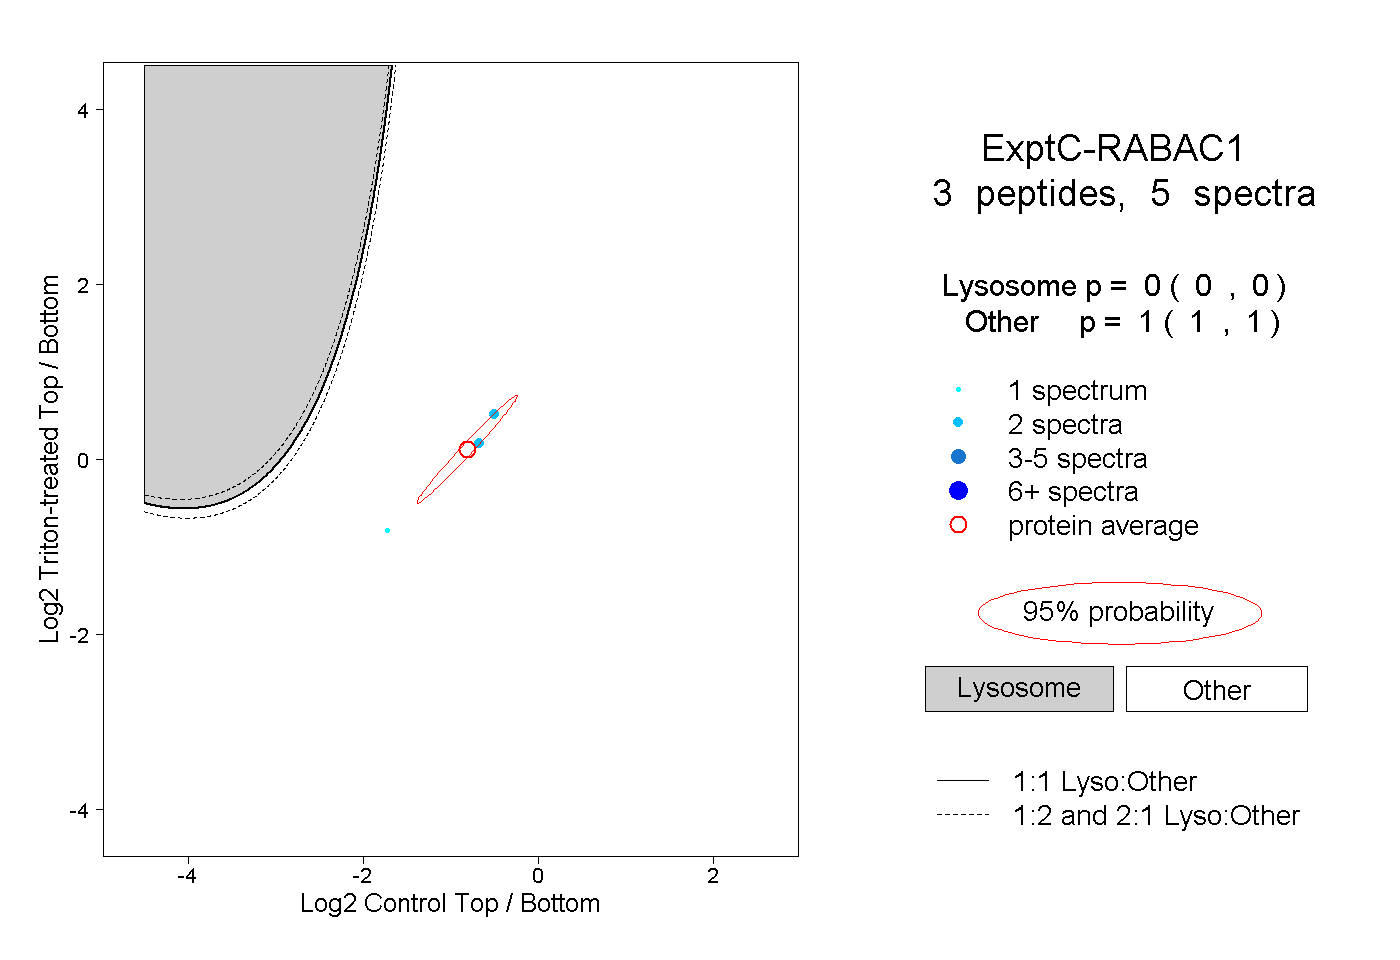
| Expt C |
3
peptides |
5
spectra |
 |
|
0.000
0.000 | 0.000 |
|
|
|
|
|
|
|
1.000
1.000 | 1.000 |
| | | Plot |
|
Lyso |
|
|
|
|
|
|
|
Other |
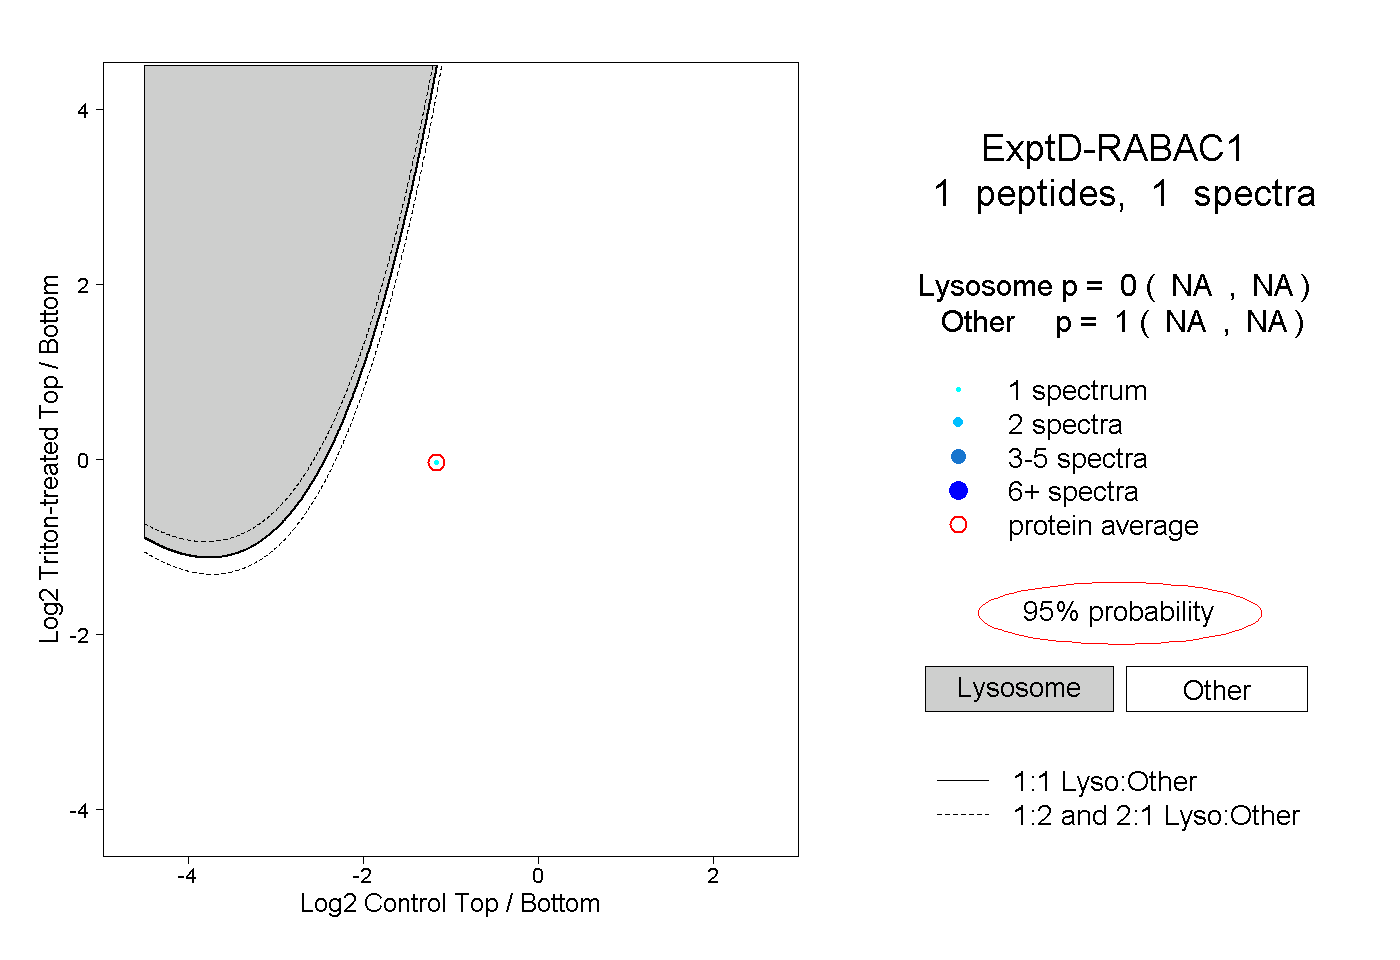
| Expt D |
1
peptide |
1
spectrum |
 |
|
0.000
NA | NA |
|
|
|
|
|
|
|
1.000
NA | NA |