 2
2peptides
spectra
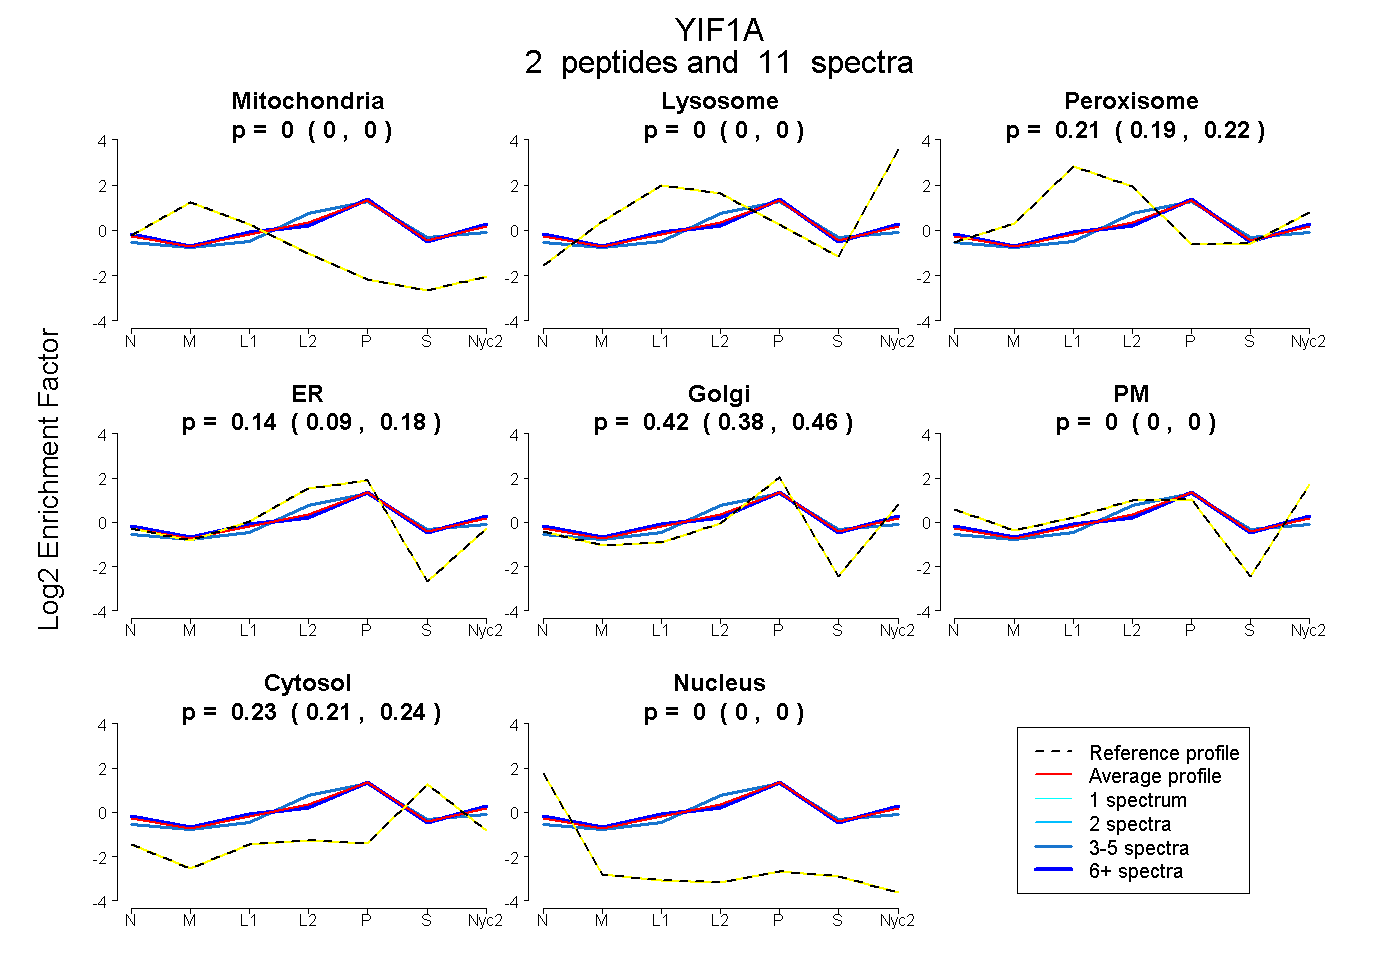
0.000 | 0.000
0.000 | 0.000
0.189 | 0.222
0.093 | 0.179
0.379 | 0.463
0.000 | 0.000
0.214 | 0.242
0.000 | 0.000
3peptides
spectra

0.000 | 0.000
0.008 | 0.356
0.000 | 0.613
0.042 | 0.679
0.000 | 0.124
0.000 | 0.108
0.000 | 0.000
4peptides
spectra
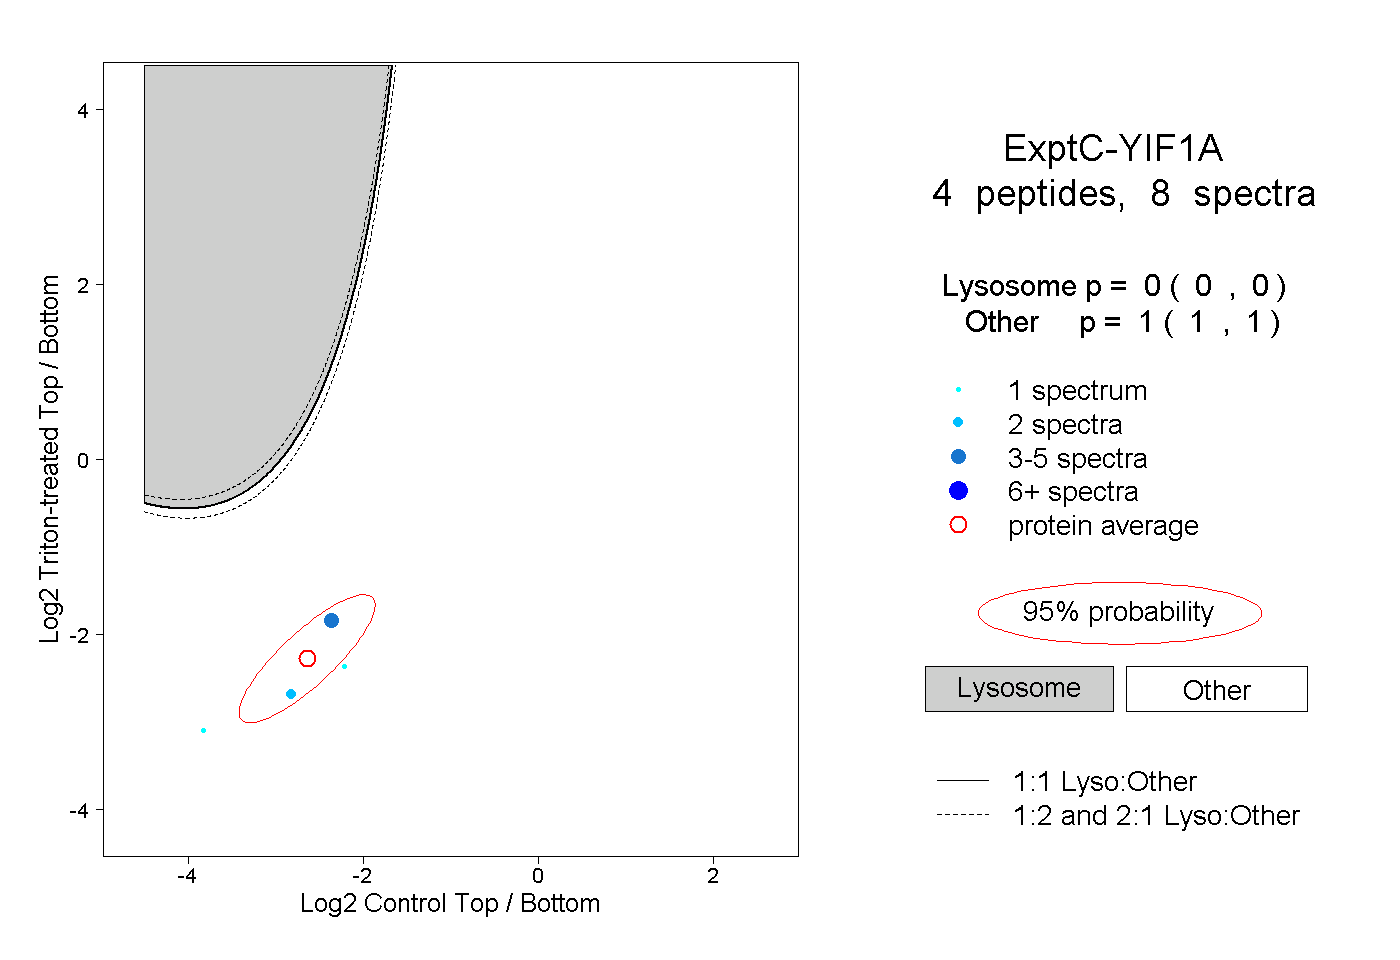
0.000 | 0.000
1.000 | 1.000