 2
2peptides
spectra
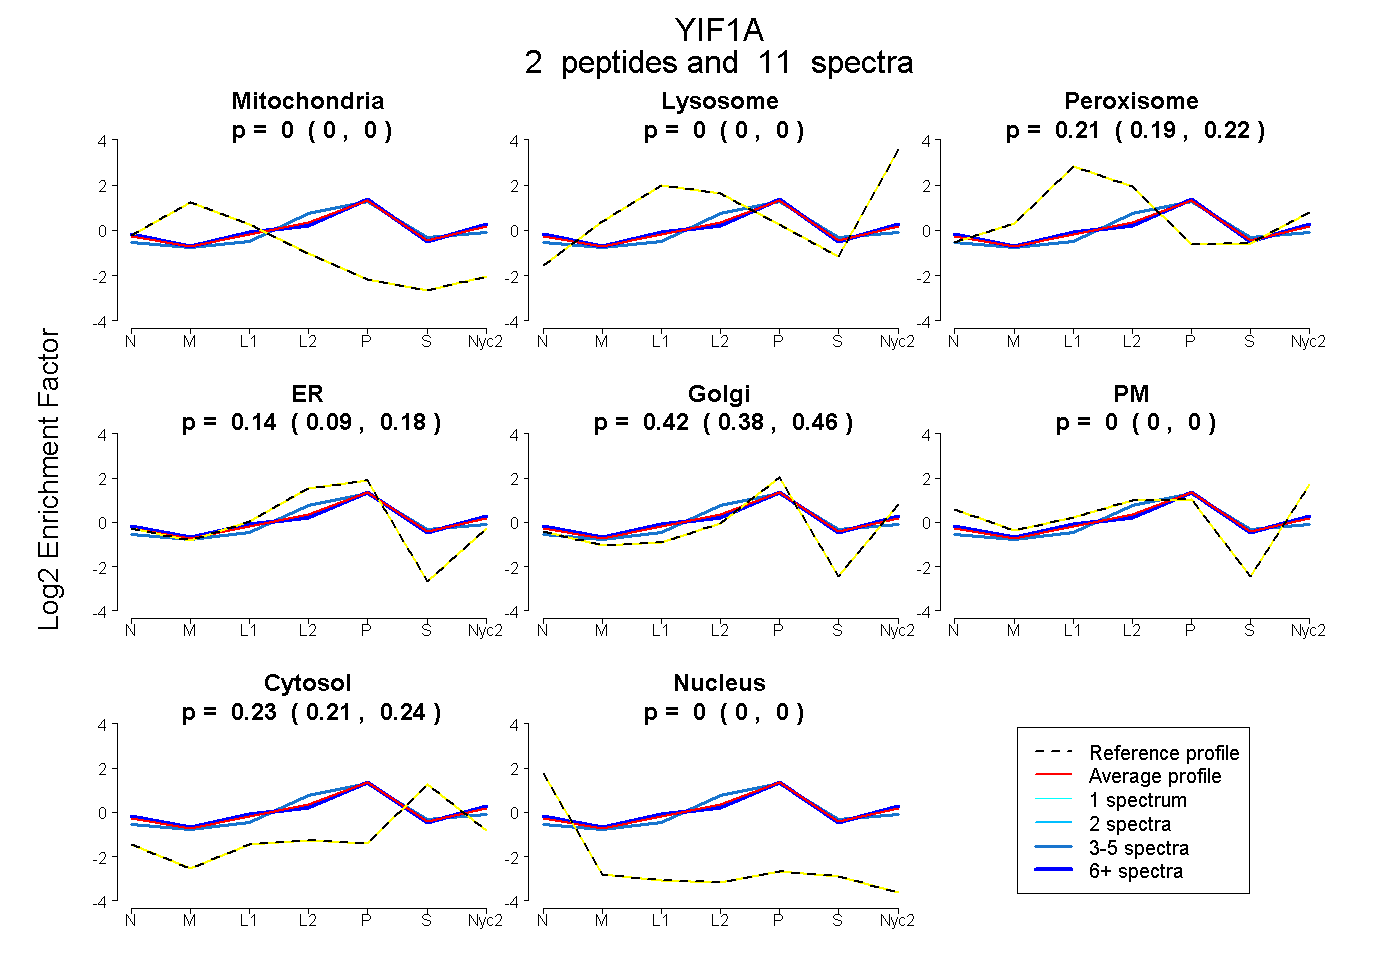
0.000 | 0.000
0.000 | 0.000
0.189 | 0.222
0.093 | 0.179
0.379 | 0.463
0.000 | 0.000
0.214 | 0.242
0.000 | 0.000
| Plot | Mito | Lyso | Perox | ER | Golgi | PM | Cytosol | Nucleus | |||||
| Expt A |
2 peptides |
11 spectra |
|
0.000 0.000 | 0.000 |
0.000 0.000 | 0.000 |
0.207 0.189 | 0.222 |
0.139 0.093 | 0.179 |
0.424 0.379 | 0.463 |
0.000 0.000 | 0.000 |
0.230 0.214 | 0.242 |
0.000 0.000 | 0.000 |
| 8 spectra, VQYSHDVPLPPR | 0.000 | 0.000 | 0.237 | 0.040 | 0.518 | 0.000 | 0.205 | 0.000 | ||
| 3 spectra, TAASGPDSMGGPTPR | 0.000 | 0.054 | 0.064 | 0.472 | 0.095 | 0.000 | 0.315 | 0.000 |
| Plot | Mito | Lyso or Perox | ER | Golgi | PM | Cytosol | Nucleus | ||||||
| Expt B |
3 peptides |
3 spectra |
 |
0.000 0.000 | 0.000 |
0.249 0.008 | 0.356 |
0.216 0.000 | 0.613 |
0.521 0.042 | 0.679 |
0.002 0.000 | 0.124 |
0.012 0.000 | 0.108 |
0.000 0.000 | 0.000 |
|||
| Plot | Lyso | Other | |||||||||||
| Expt C |
4 peptides |
8 spectra |
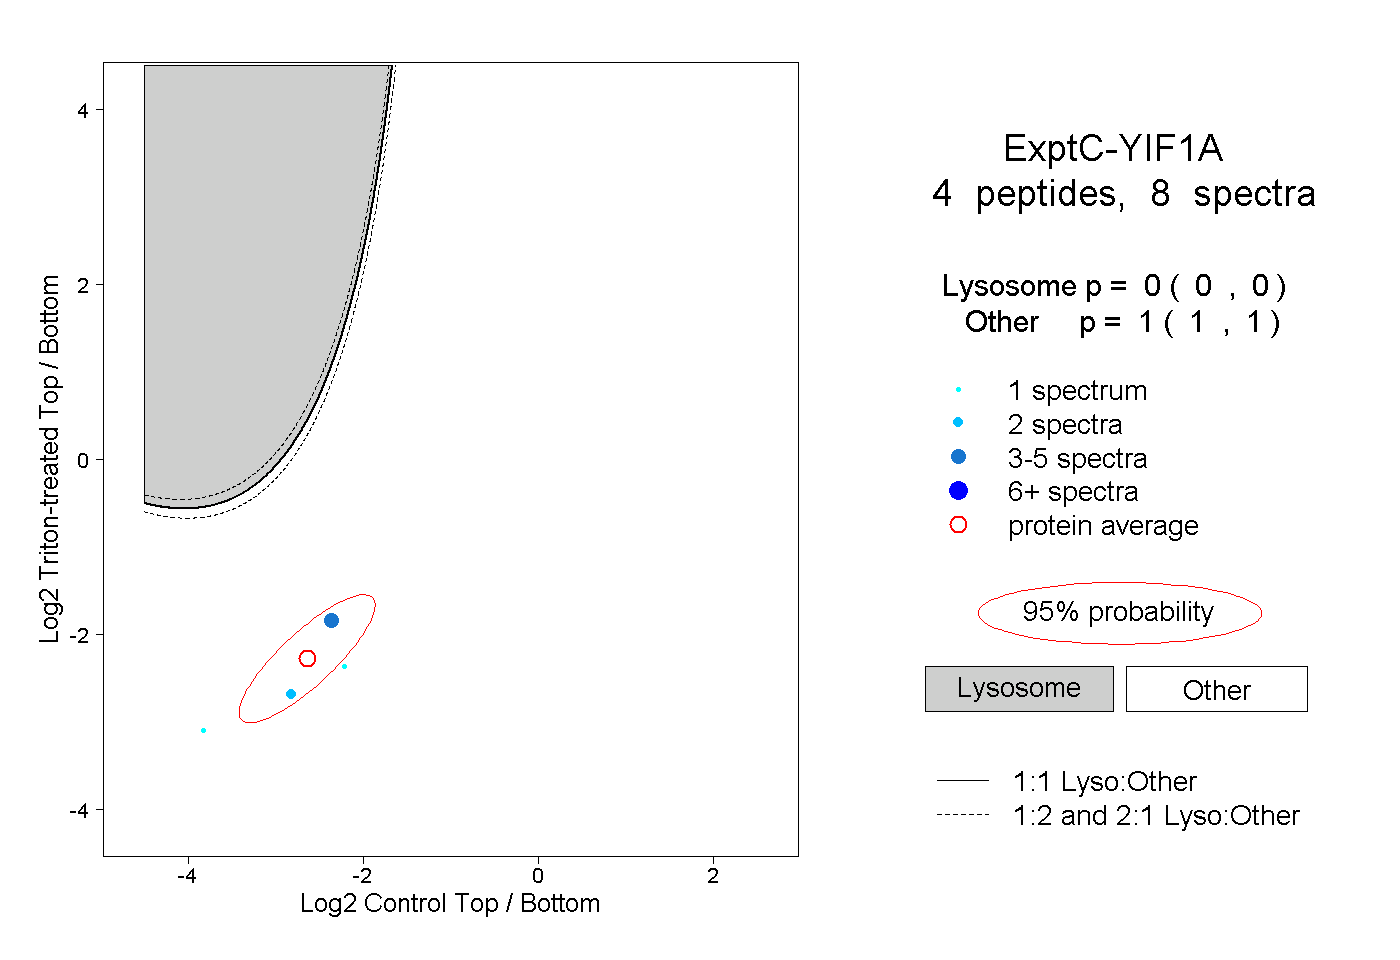 |
0.000 0.000 | 0.000 |
1.000 1.000 | 1.000 |