 14
14peptides
spectra
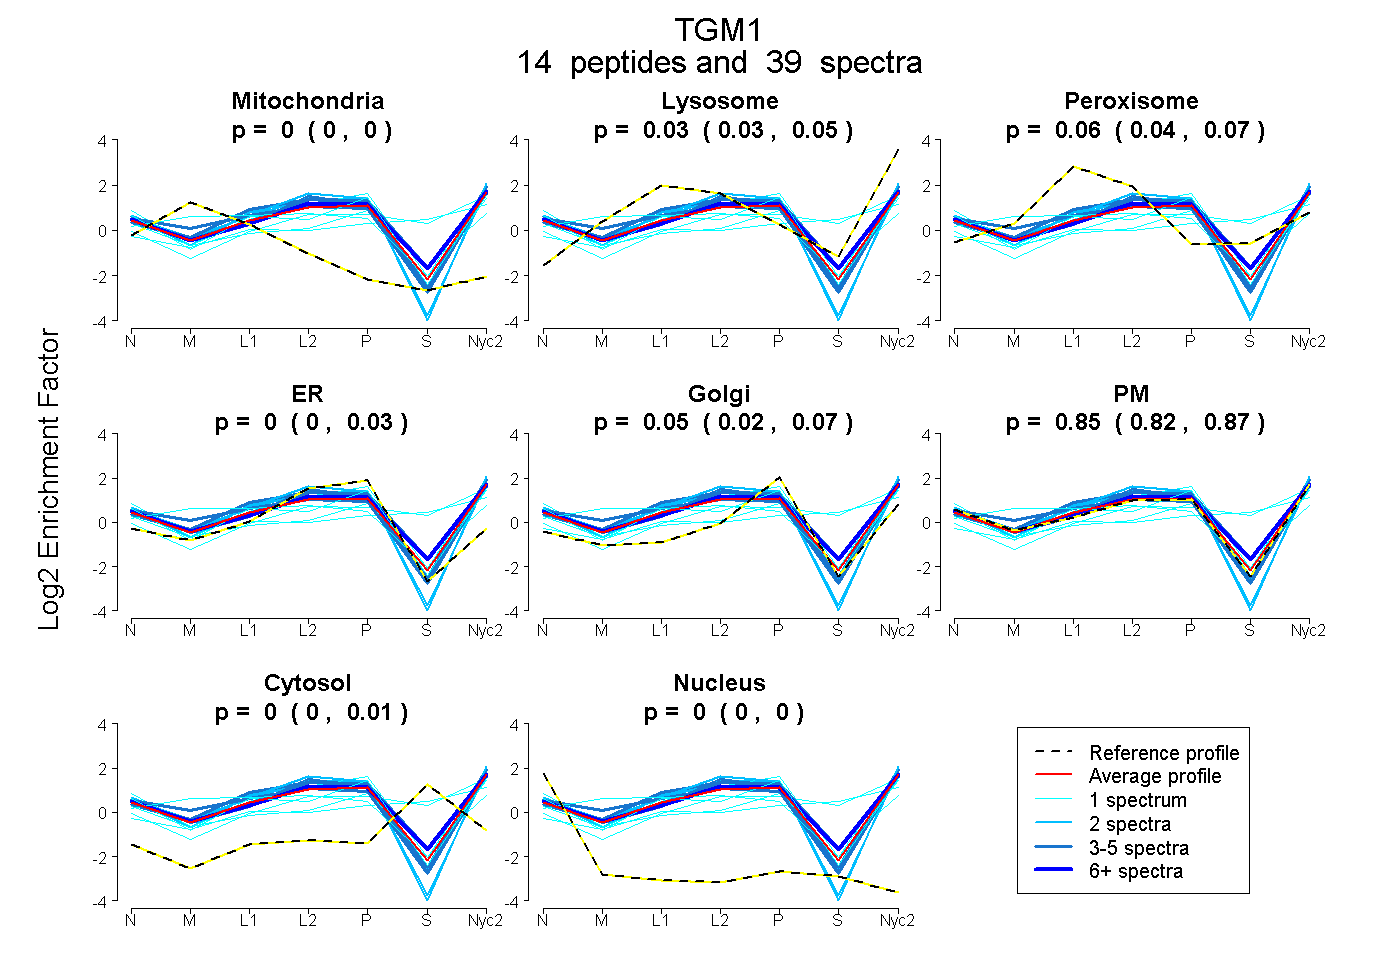
0.000 | 0.000
0.027 | 0.046
0.039 | 0.073
0.000 | 0.031
0.016 | 0.066
0.824 | 0.865
0.000 | 0.006
0.000 | 0.000
1peptide
spectrum
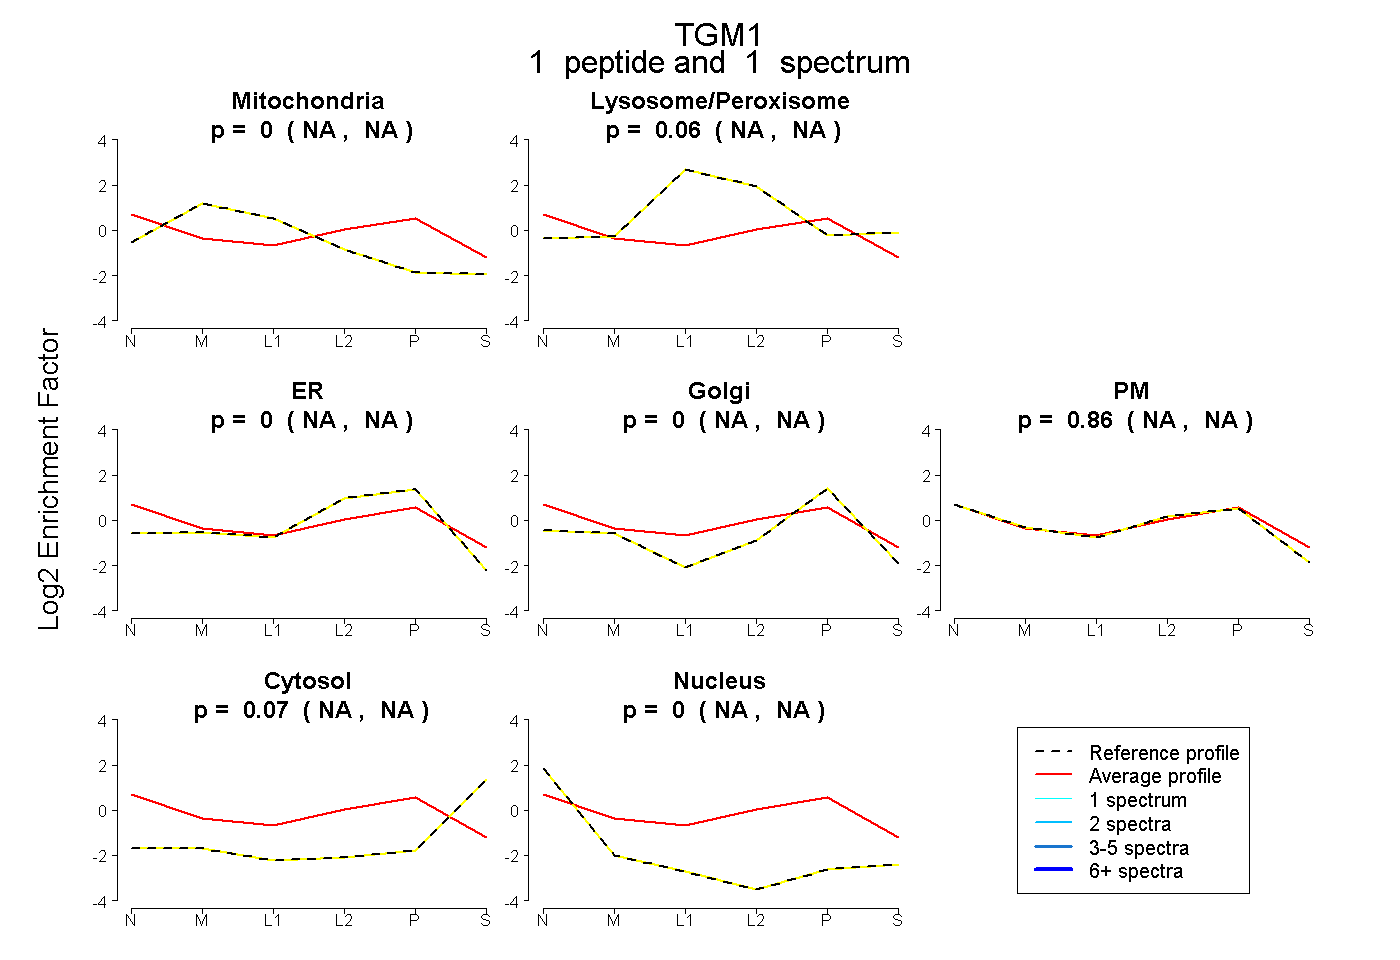
NA | NA
NA | NA
NA | NA
NA | NA
NA | NA
NA | NA
NA | NA
19peptides
spectra
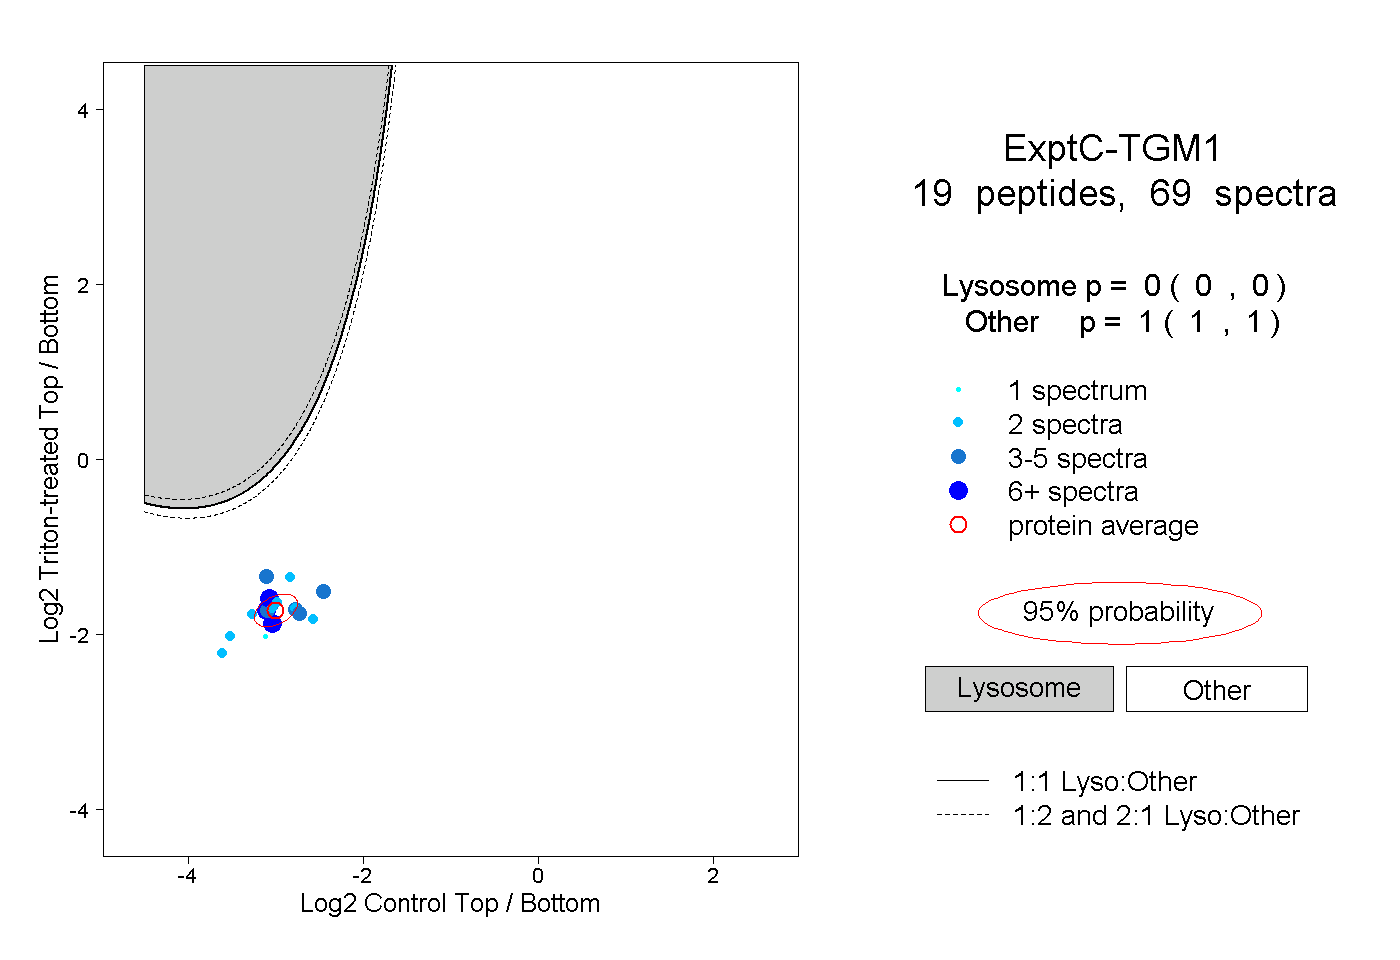
0.000 | 0.000
1.000 | 1.000
6peptides
spectra
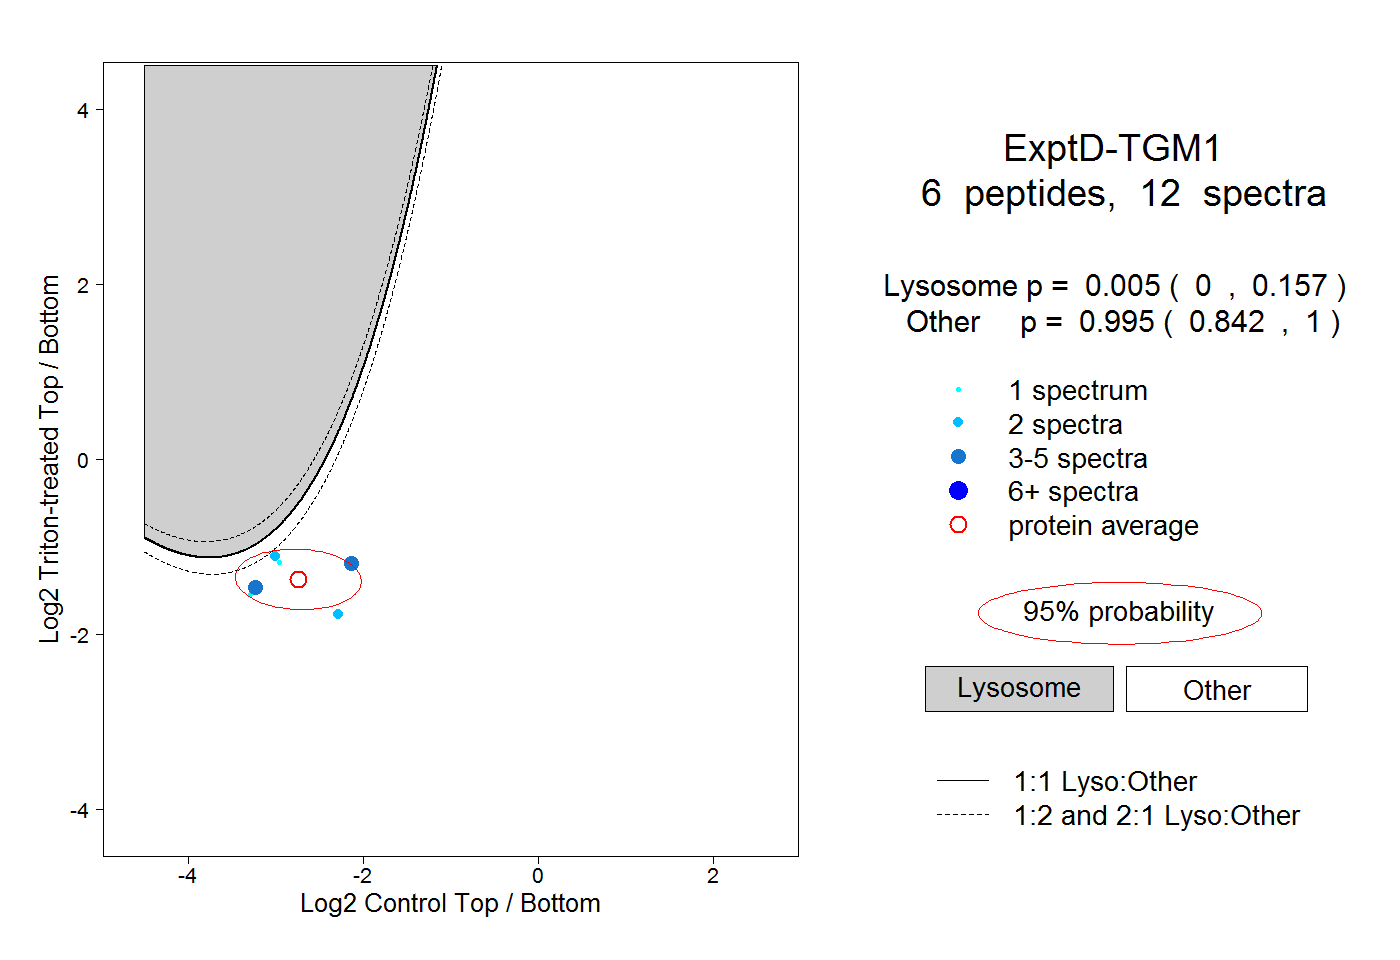
0.000 | 0.157
0.842 | 1.000