 14
14peptides
spectra
0.000 | 0.000
0.027 | 0.046
0.039 | 0.073
0.000 | 0.031
0.016 | 0.066
0.824 | 0.865
0.000 | 0.006
0.000 | 0.000
| Plot | Mito | Lyso | Perox | ER | Golgi | PM | Cytosol | Nucleus | |||||
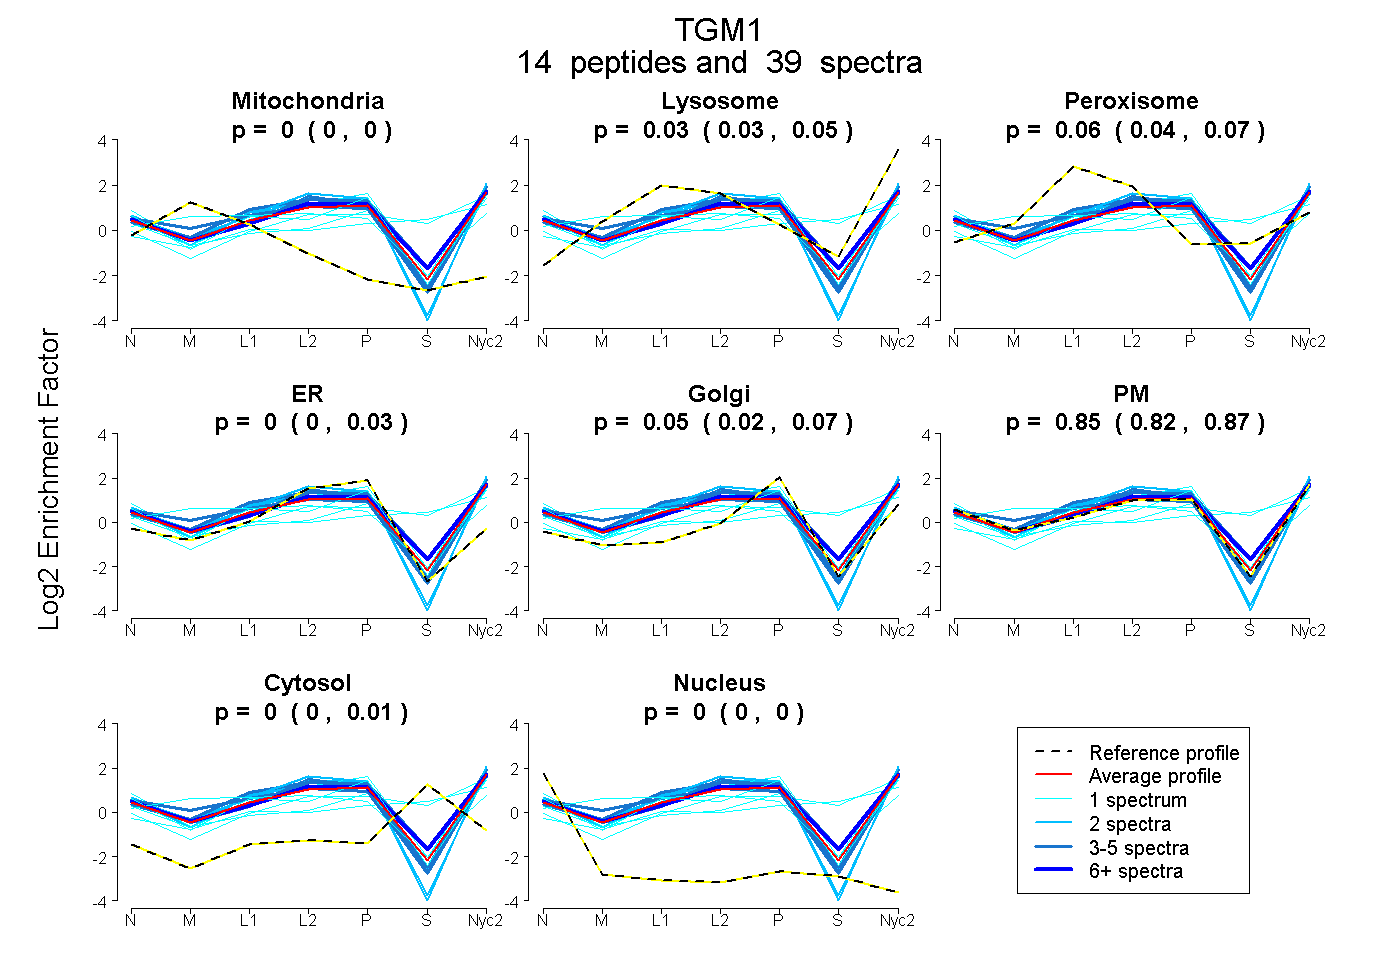
| Expt A |
14 peptides |
39 spectra |
|
0.000 0.000 | 0.000 |
0.035 0.027 | 0.046 |
0.064 0.039 | 0.073 |
0.003 0.000 | 0.031 |
0.053 0.016 | 0.066 |
0.846 0.824 | 0.865 |
0.000 0.000 | 0.006 |
0.000 0.000 | 0.000 |
| 3 spectra, LEGSGLQRPK | 0.000 | 0.117 | 0.044 | 0.135 | 0.000 | 0.679 | 0.025 | 0.000 | ||
| 1 spectrum, VHTSPNAIIGK | 0.000 | 0.000 | 0.036 | 0.000 | 0.184 | 0.780 | 0.000 | 0.000 | ||
| 4 spectra, FQFTVR | 0.000 | 0.040 | 0.000 | 0.004 | 0.000 | 0.956 | 0.000 | 0.000 | ||
| 3 spectra, IYYGTEAQIGER | 0.032 | 0.077 | 0.002 | 0.000 | 0.000 | 0.889 | 0.000 | 0.000 | ||
| 1 spectrum, AIGTLIVTK | 0.000 | 0.229 | 0.048 | 0.000 | 0.000 | 0.283 | 0.440 | 0.000 | ||
| 1 spectrum, ESGQVLAK | 0.000 | 0.245 | 0.000 | 0.000 | 0.000 | 0.392 | 0.363 | 0.000 | ||
| 4 spectra, GSGVNAAGDGTIR | 0.000 | 0.169 | 0.002 | 0.080 | 0.000 | 0.749 | 0.000 | 0.000 | ||
| 1 spectrum, IVYVEEK | 0.000 | 0.000 | 0.012 | 0.000 | 0.056 | 0.734 | 0.117 | 0.081 | ||
| 1 spectrum, SGENIPMAFR | 0.173 | 0.205 | 0.026 | 0.000 | 0.000 | 0.596 | 0.000 | 0.000 | ||
| 1 spectrum, GMPYGGR | 0.000 | 0.149 | 0.000 | 0.060 | 0.118 | 0.673 | 0.000 | 0.000 | ||
| 2 spectra, GFSEAVGDSR | 0.000 | 0.031 | 0.036 | 0.075 | 0.000 | 0.857 | 0.000 | 0.000 | ||
| 13 spectra, QTFVPVRPGPR | 0.000 | 0.070 | 0.046 | 0.018 | 0.000 | 0.819 | 0.048 | 0.000 | ||
| 2 spectra, ADDDWGPEPSGSR | 0.000 | 0.000 | 0.000 | 0.075 | 0.000 | 0.925 | 0.000 | 0.000 | ||
| 2 spectra, HPEGSEAER | 0.000 | 0.000 | 0.000 | 0.019 | 0.000 | 0.981 | 0.000 | 0.000 |
| Plot | Mito | Lyso or Perox | ER | Golgi | PM | Cytosol | Nucleus | ||||||
| Expt B |
1 peptide |
1 spectrum |
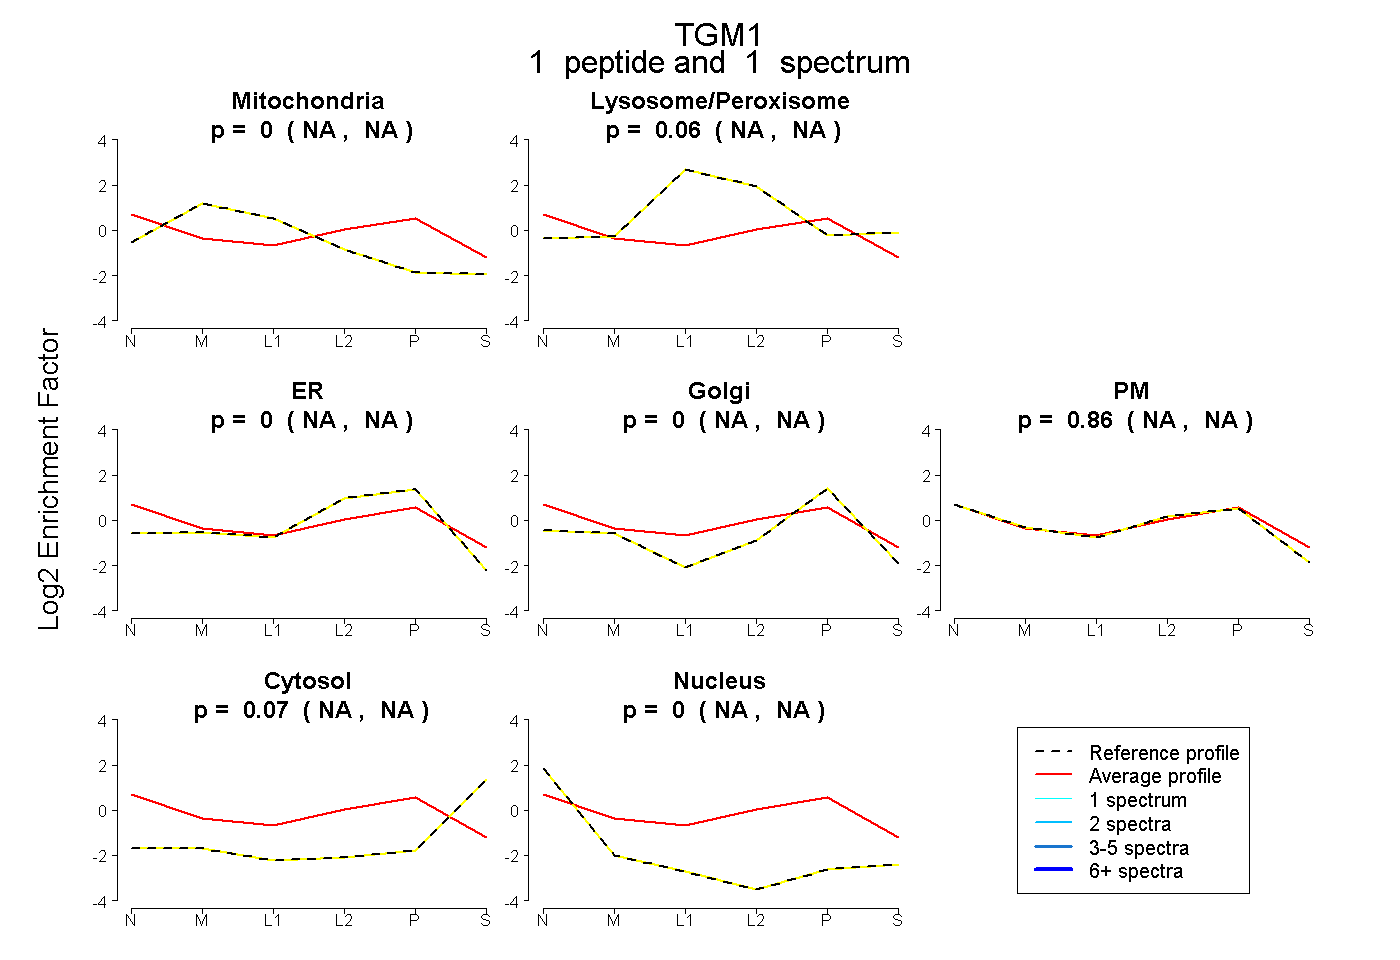 |
0.000 NA | NA |
0.061 NA | NA |
0.000 NA | NA |
0.000 NA | NA |
0.865 NA | NA |
0.075 NA | NA |
0.000 NA | NA |
|||
| Plot | Lyso | Other | |||||||||||
| Expt C |
19 peptides |
69 spectra |
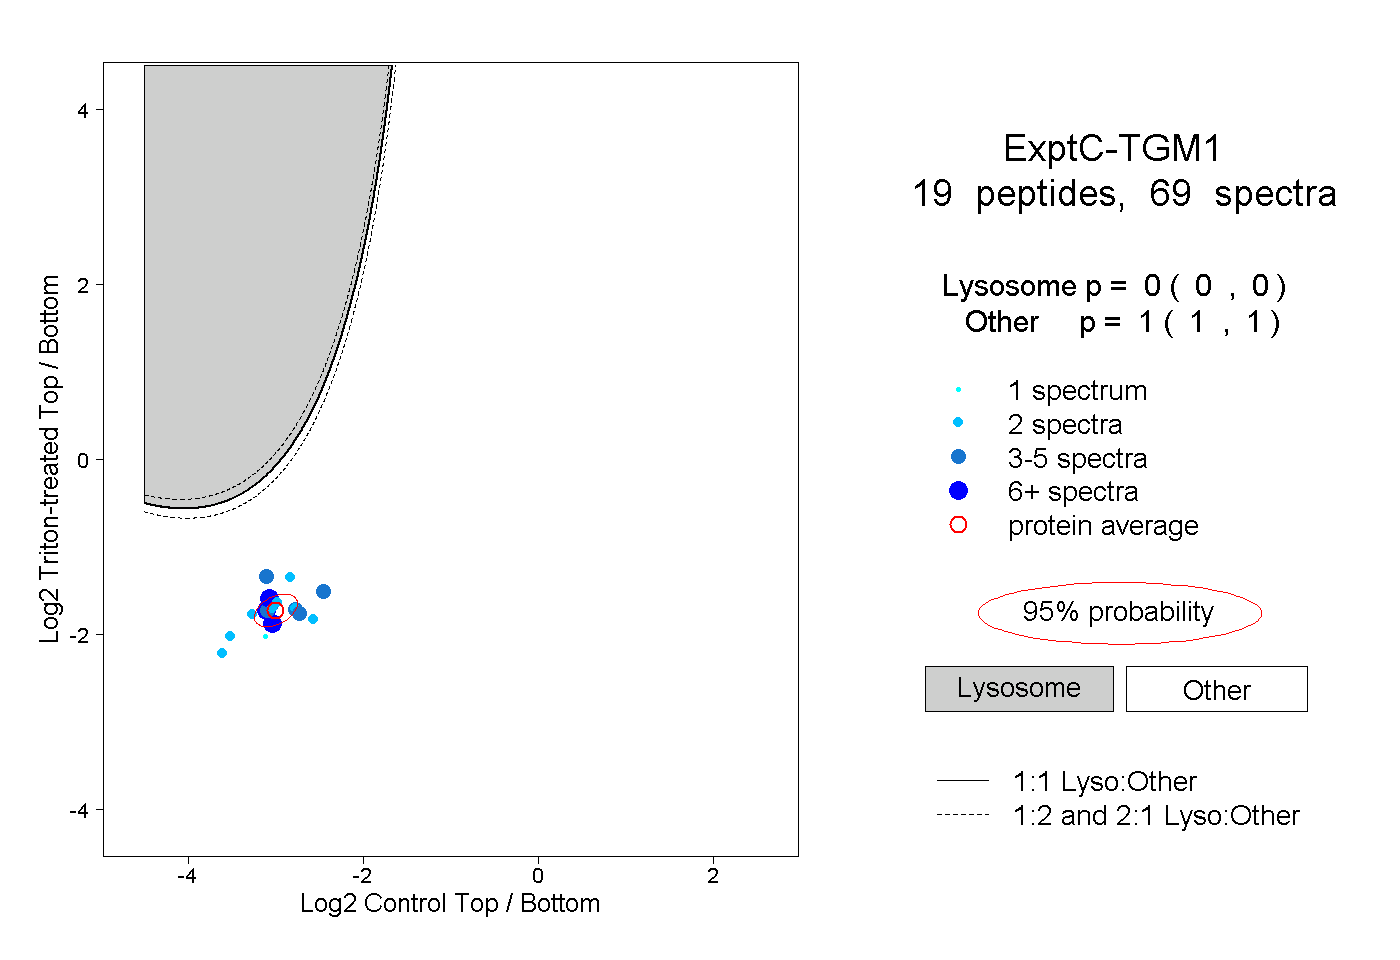 |
0.000 0.000 | 0.000 |
1.000 1.000 | 1.000 |
||||||||
| Plot | Lyso | Other | |||||||||||
| Expt D |
6 peptides |
12 spectra |
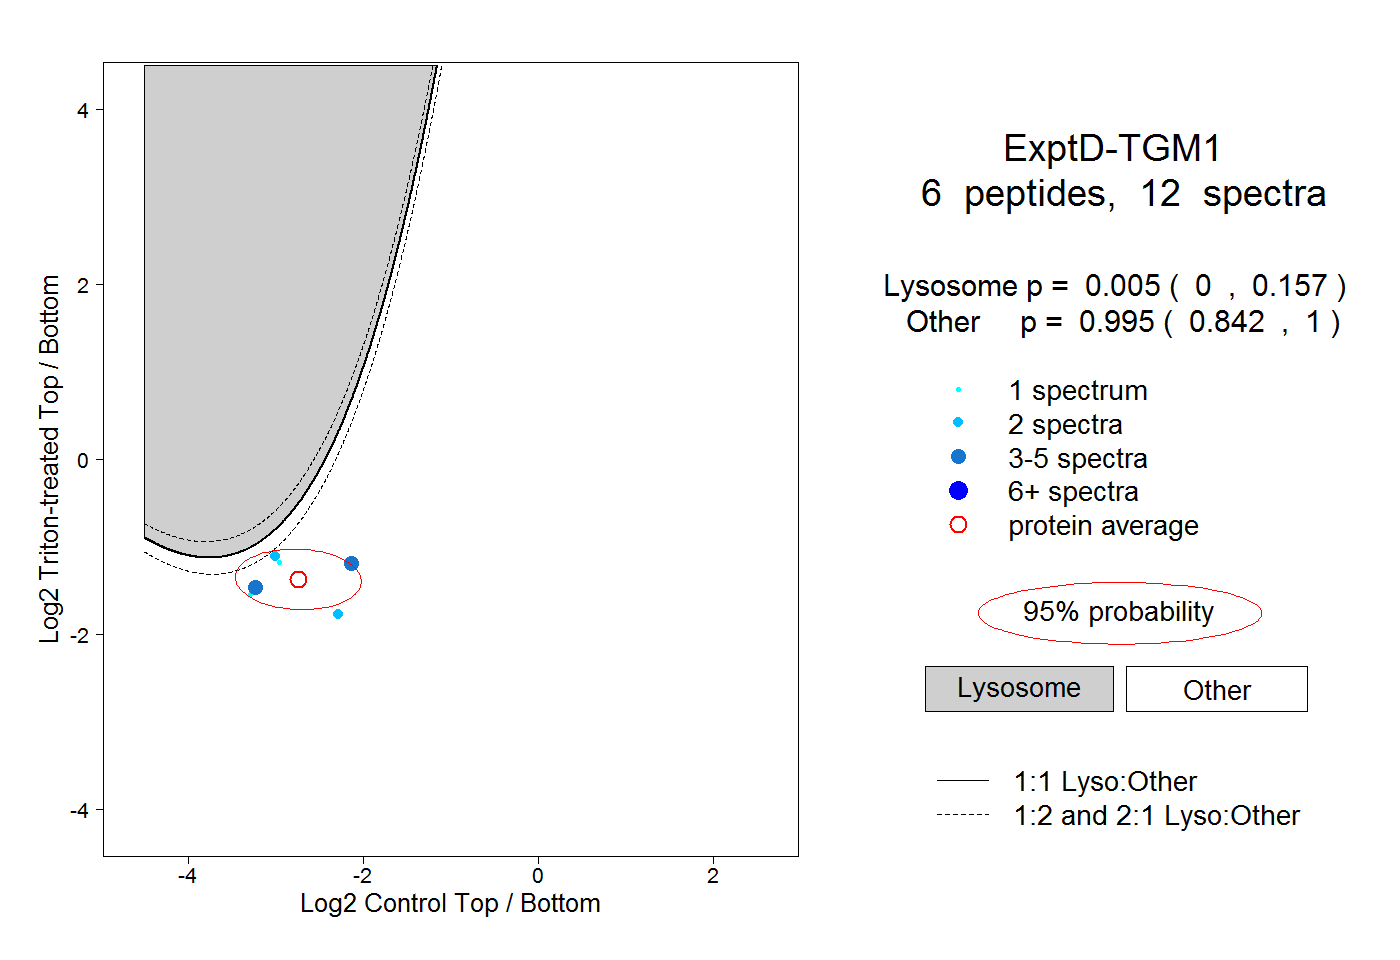 |
0.005 0.000 | 0.157 |
0.995 0.842 | 1.000 |