 2
2peptides
spectra
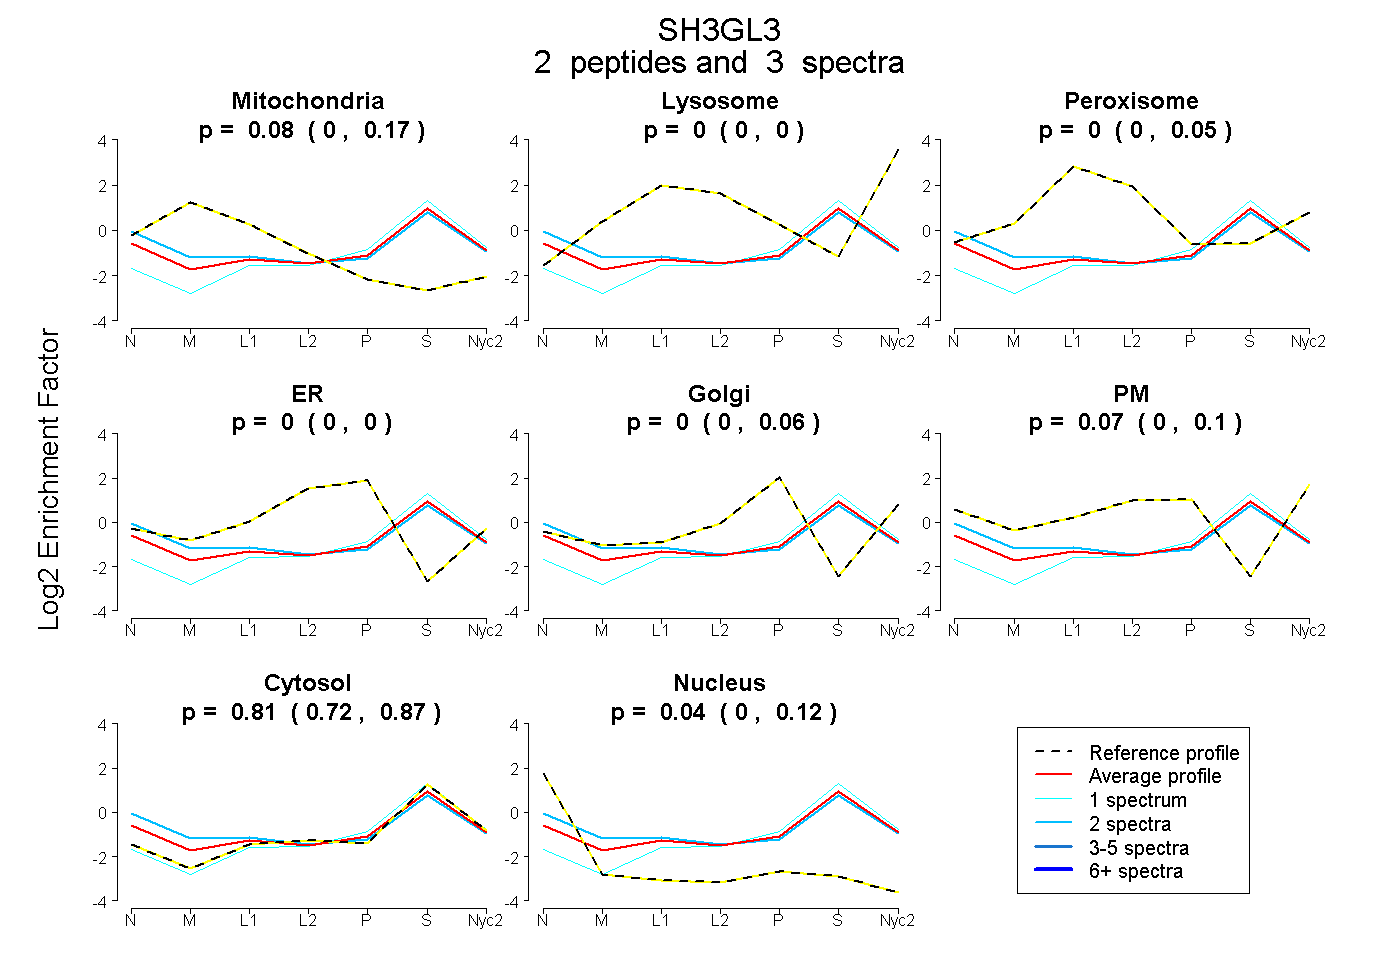
0.000 | 0.167
0.000 | 0.000
0.000 | 0.053
0.000 | 0.000
0.000 | 0.060
0.000 | 0.100
0.715 | 0.870
0.000 | 0.124
1peptide
spectrum
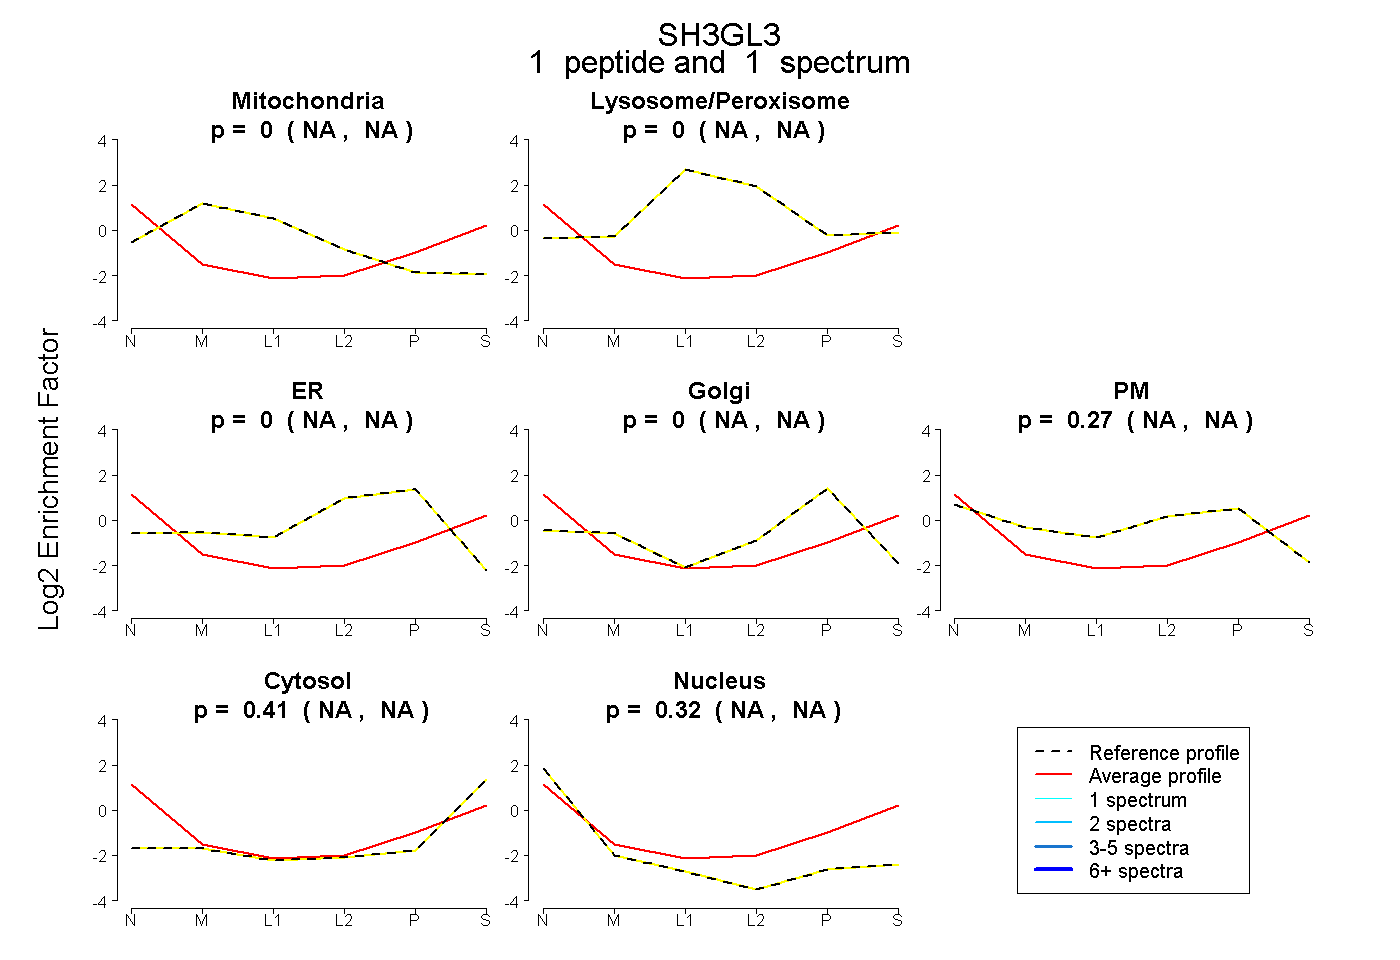
NA | NA
NA | NA
NA | NA
NA | NA
NA | NA
NA | NA
NA | NA
1peptide
spectra
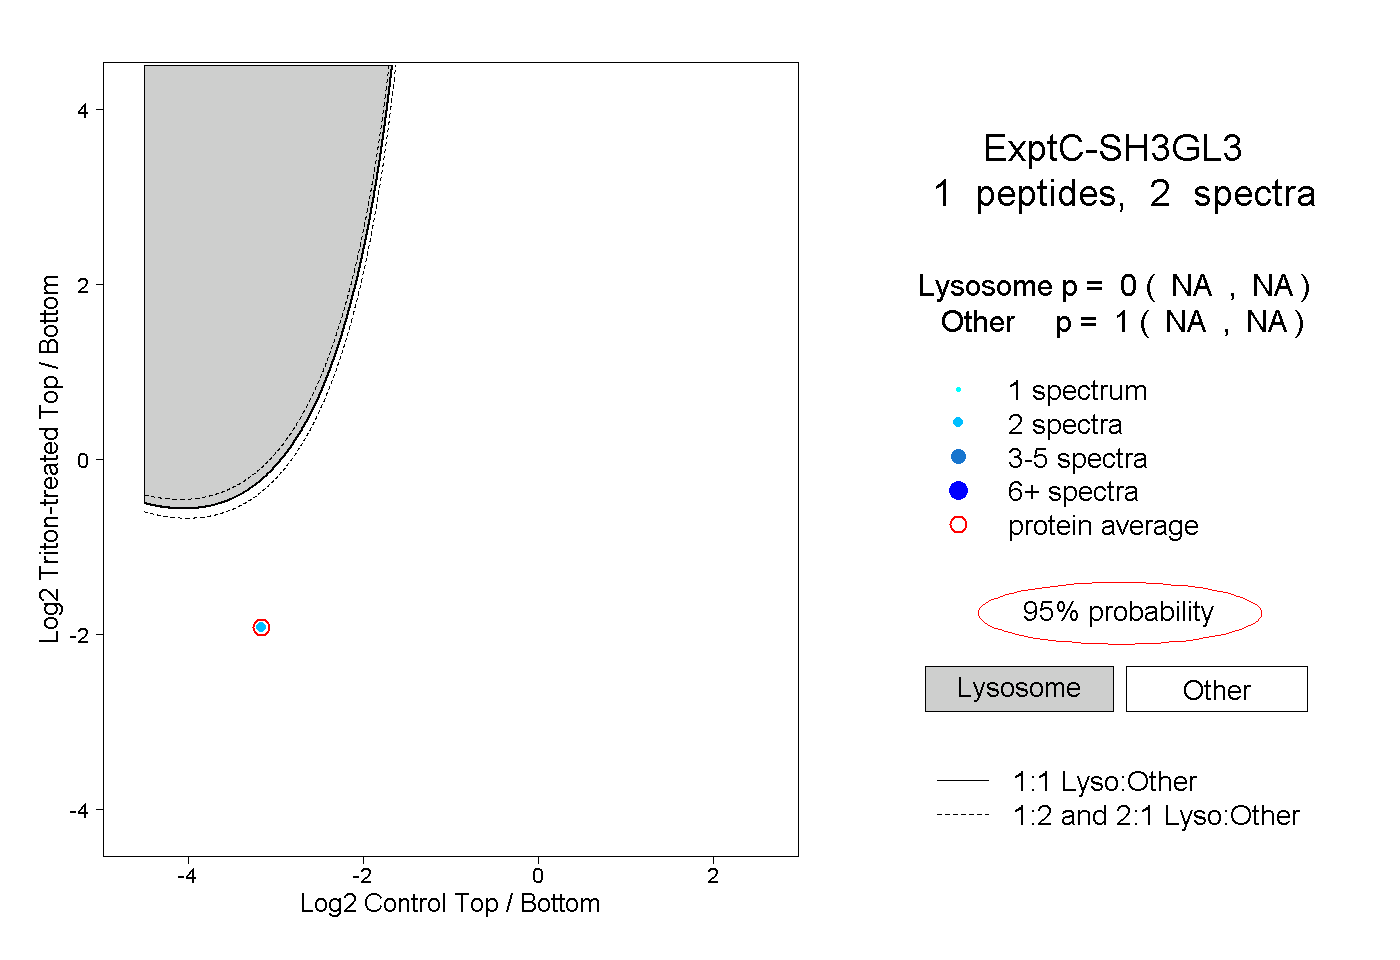
NA | NA
NA | NA