 2
2peptides
spectra
0.000 | 0.167
0.000 | 0.000
0.000 | 0.053
0.000 | 0.000
0.000 | 0.060
0.000 | 0.100
0.715 | 0.870
0.000 | 0.124
| Plot | Mito | Lyso | Perox | ER | Golgi | PM | Cytosol | Nucleus | |||||
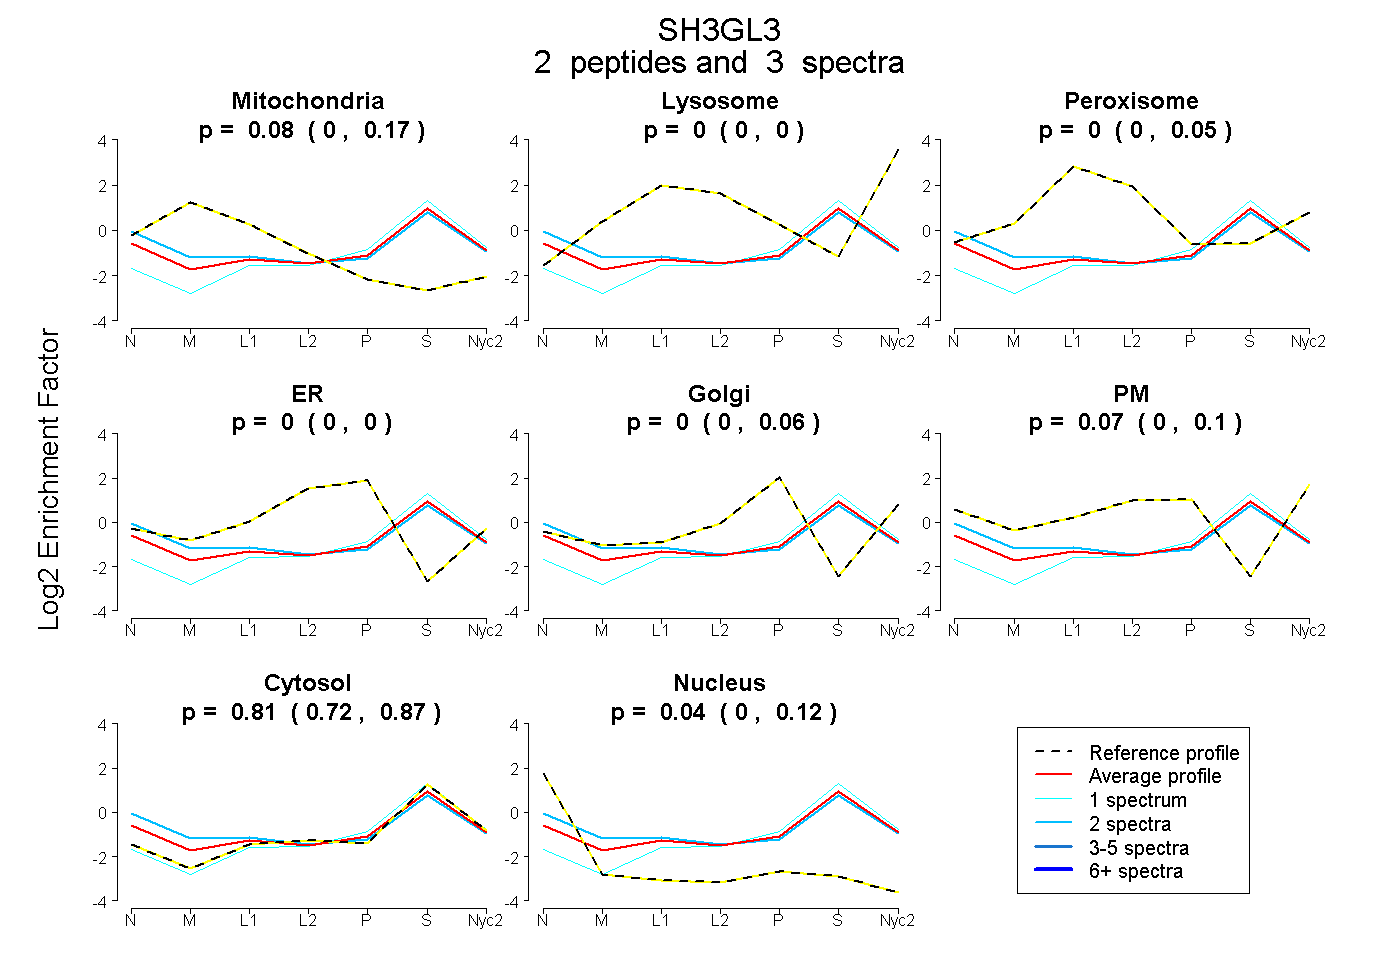
| Expt A |
2 peptides |
3 spectra |
|
0.083 0.000 | 0.167 |
0.000 0.000 | 0.000 |
0.000 0.000 | 0.053 |
0.000 0.000 | 0.000 |
0.000 0.000 | 0.060 |
0.065 0.000 | 0.100 |
0.812 0.715 | 0.870 |
0.040 0.000 | 0.124 |
| 1 spectrum, LDEEFLDMEK | 0.000 | 0.000 | 0.000 | 0.000 | 0.021 | 0.000 | 0.979 | 0.000 | ||
| 2 spectra, ATEYLQPNPAYR | 0.165 | 0.000 | 0.009 | 0.000 | 0.000 | 0.077 | 0.692 | 0.058 |
| Plot | Mito | Lyso or Perox | ER | Golgi | PM | Cytosol | Nucleus | ||||||
| Expt B |
1 peptide |
1 spectrum |
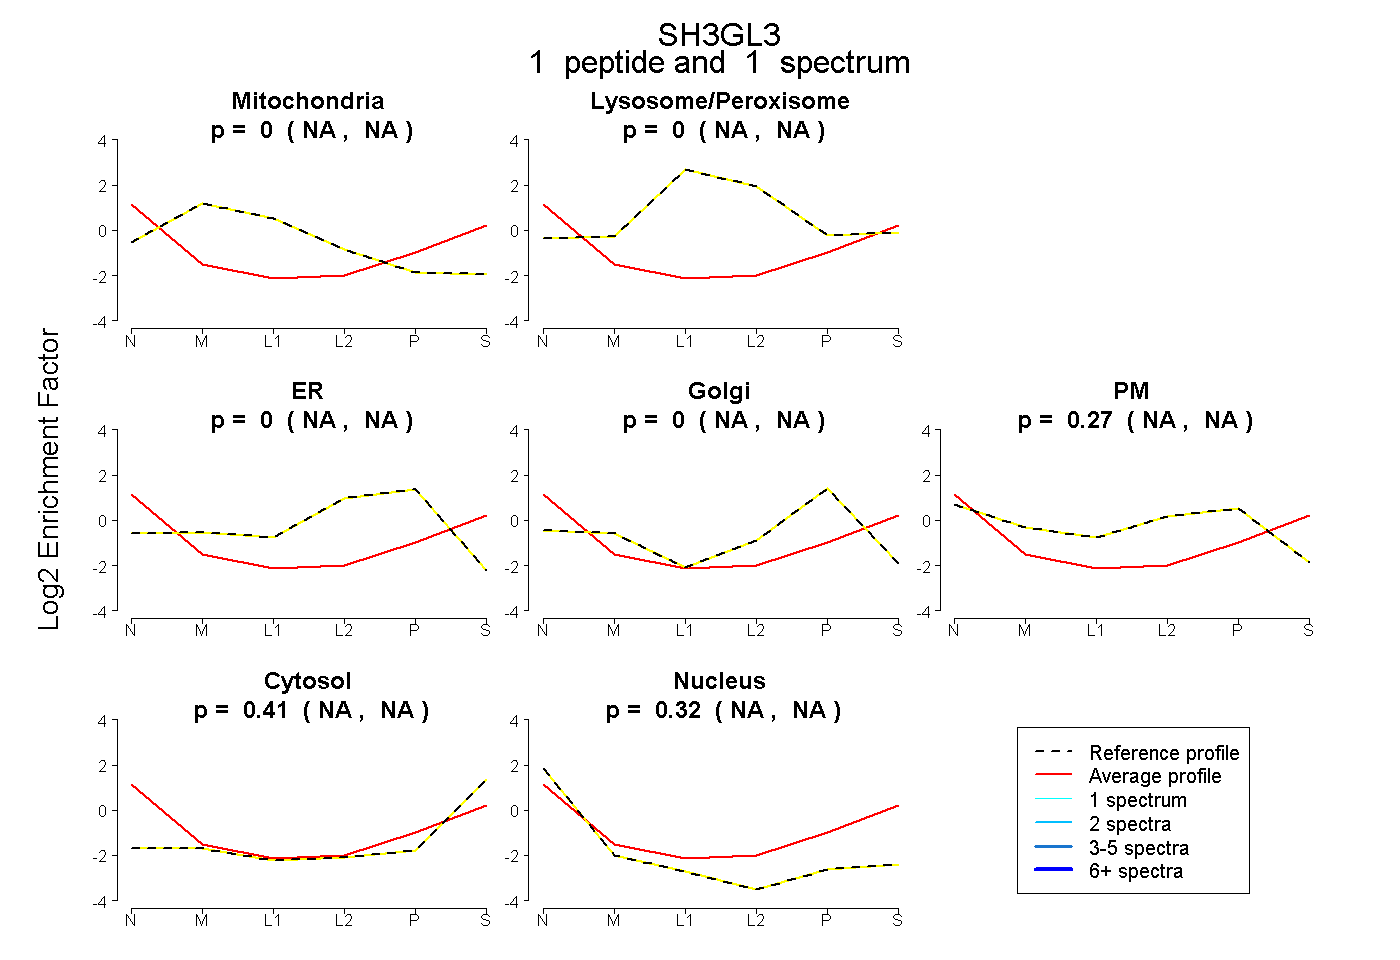 |
0.000 NA | NA |
0.000 NA | NA |
0.000 NA | NA |
0.000 NA | NA |
0.271 NA | NA |
0.406 NA | NA |
0.323 NA | NA |
|||
| Plot | Lyso | Other | |||||||||||
| Expt C |
1 peptide |
2 spectra |
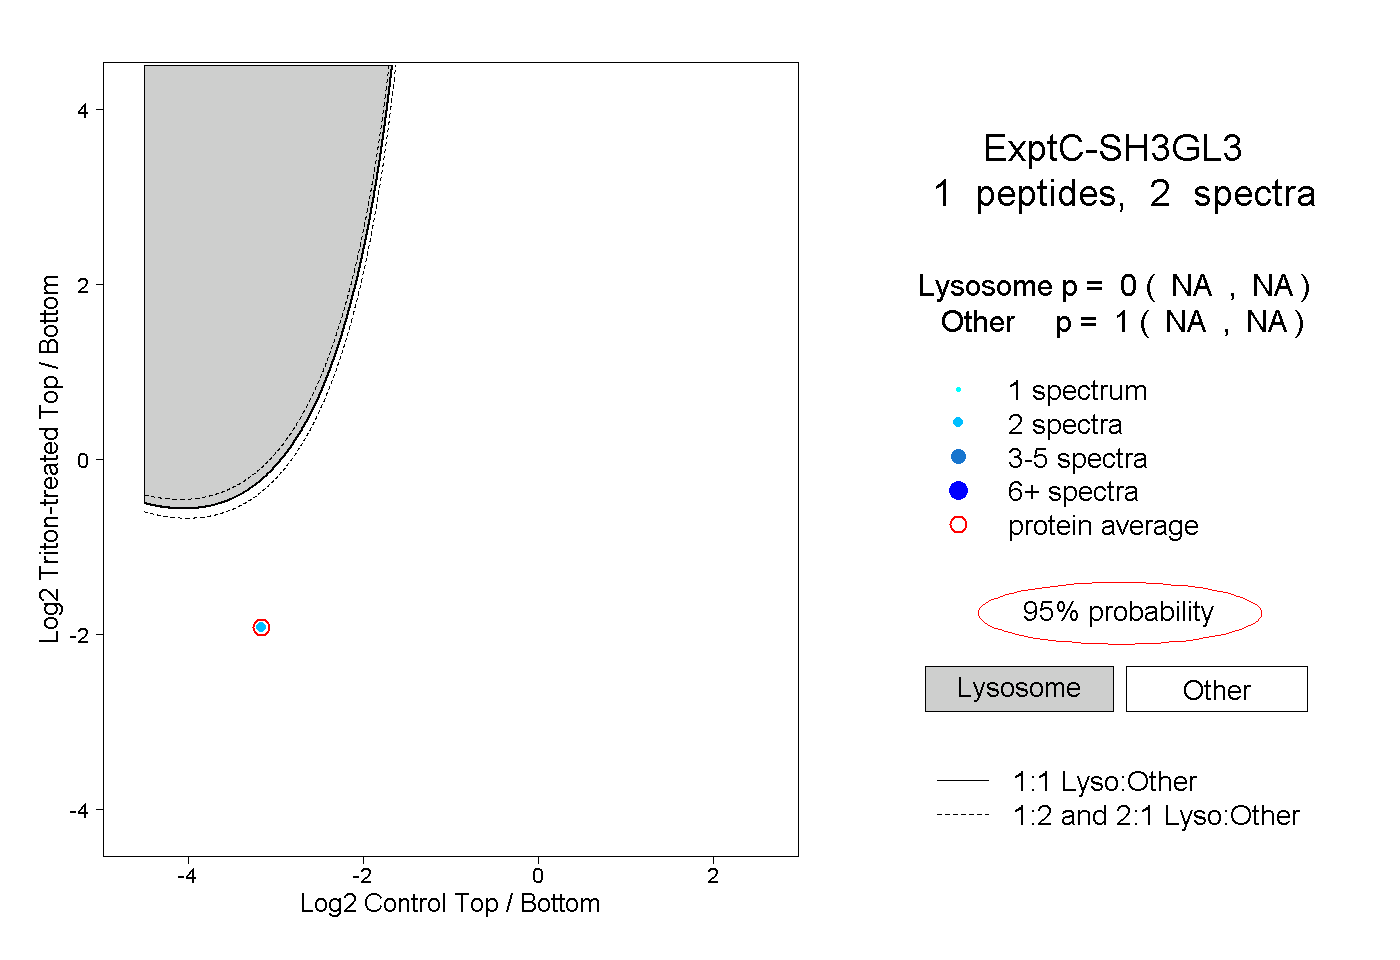 |
0.000 NA | NA |
1.000 NA | NA |