 10
10peptides
spectra

0.000 | 0.000
0.117 | 0.144
0.000 | 0.010
0.366 | 0.424
0.000 | 0.047
0.330 | 0.378
0.077 | 0.105
0.000 | 0.000
9peptides
spectra
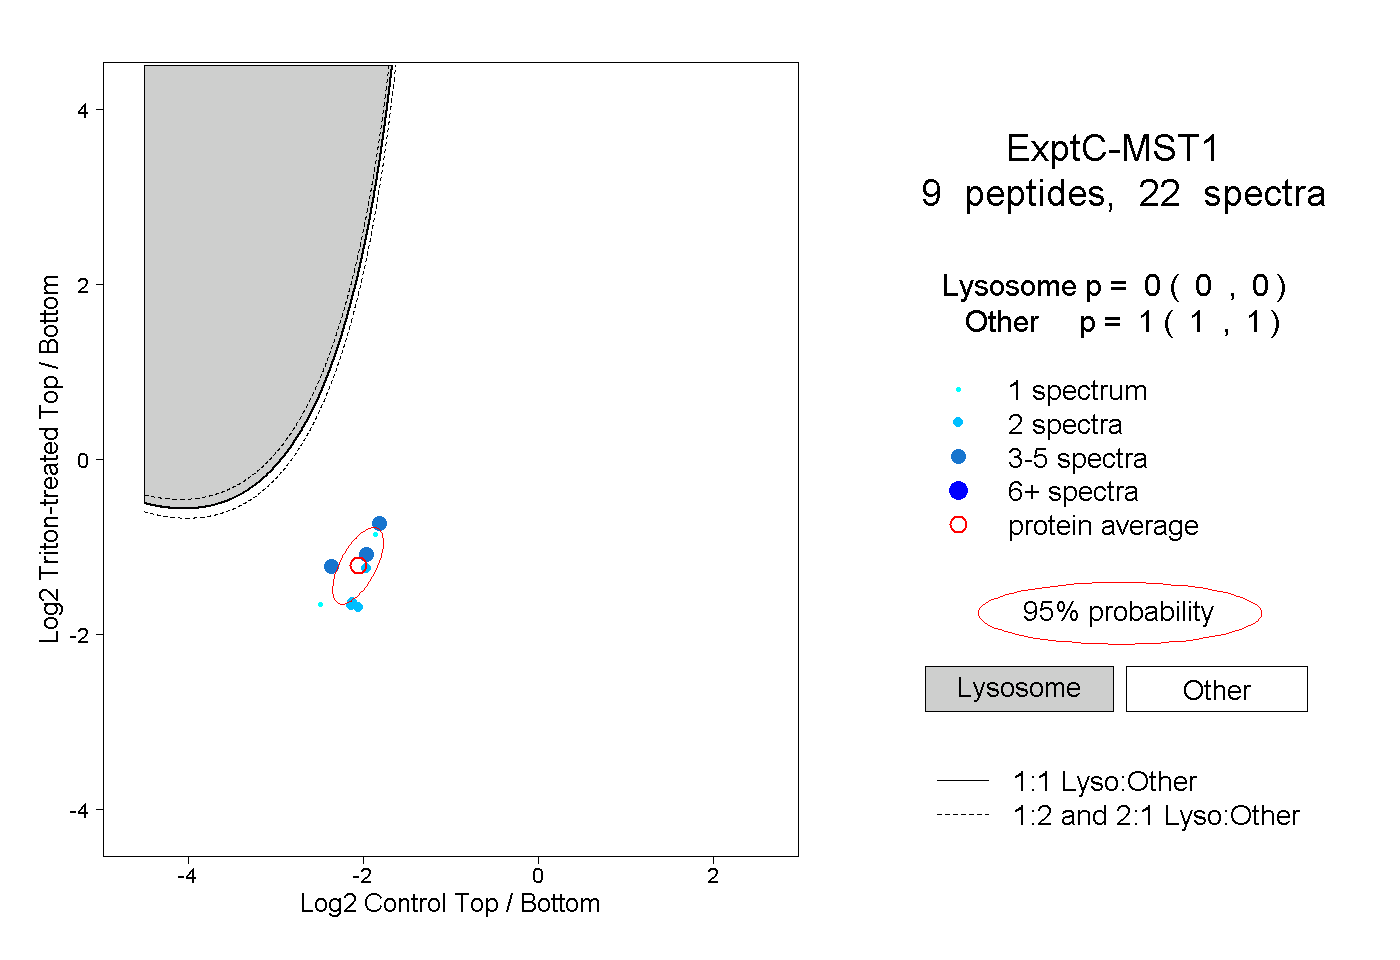
0.000 | 0.000
1.000 | 1.000
1peptide
spectra
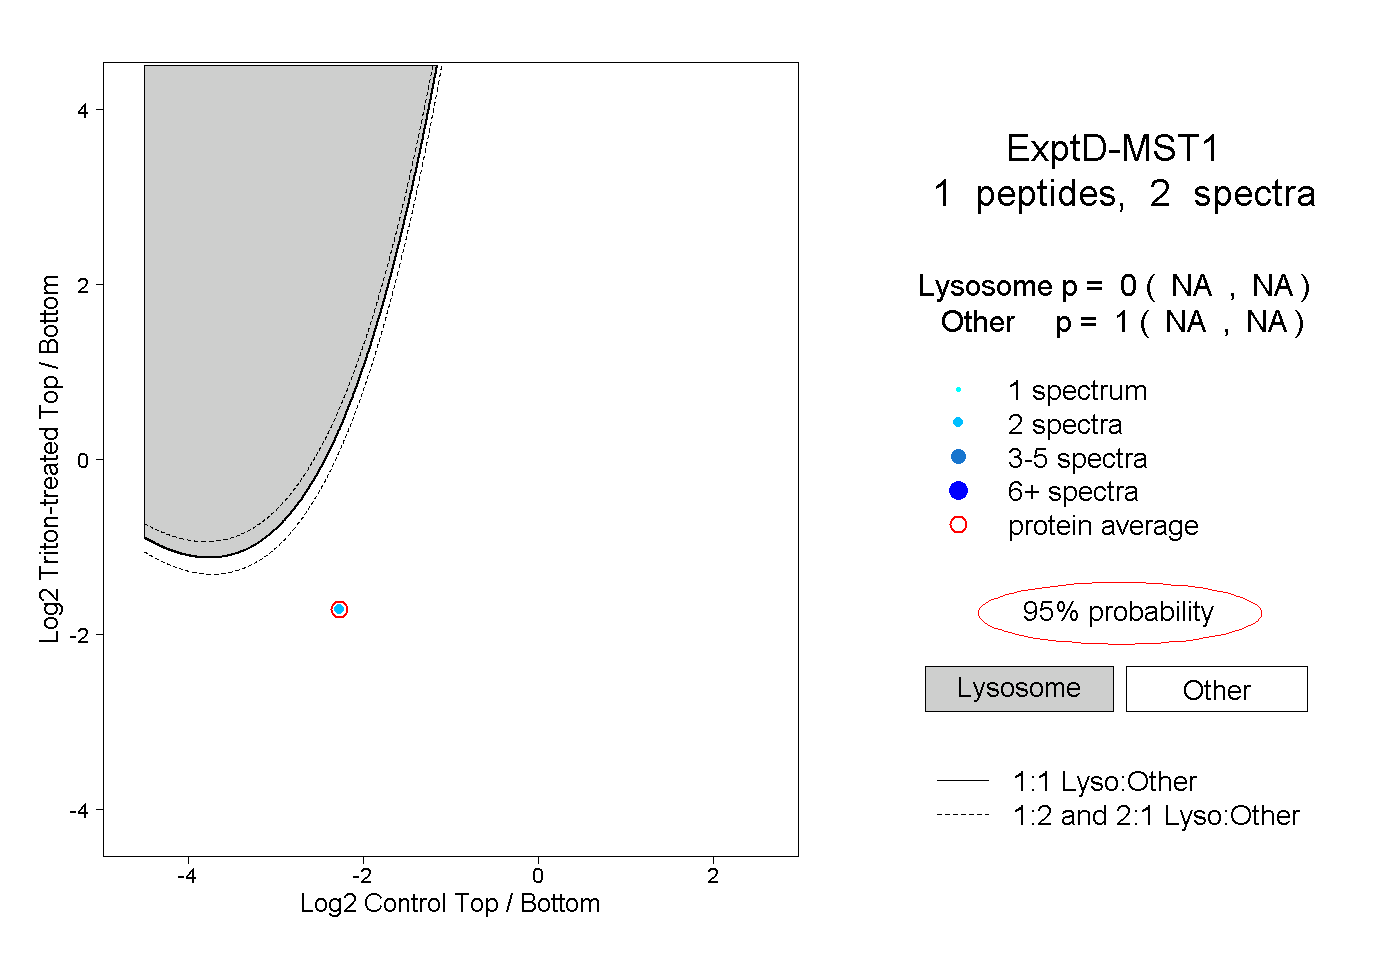
NA | NA
NA | NA