 10
10peptides
spectra

0.000 | 0.000
0.117 | 0.144
0.000 | 0.010
0.366 | 0.424
0.000 | 0.047
0.330 | 0.378
0.077 | 0.105
0.000 | 0.000
9peptides
spectra
0.000 | 0.000
1.000 | 1.000
| Plot | Mito | Lyso | Perox | ER | Golgi | PM | Cytosol | Nucleus | |||||
| Expt A |
10 peptides |
24 spectra |
|
0.000 0.000 | 0.000 |
0.132 0.117 | 0.144 |
0.000 0.000 | 0.010 |
0.402 0.366 | 0.424 |
0.015 0.000 | 0.047 |
0.358 0.330 | 0.378 |
0.093 0.077 | 0.105 |
0.000 0.000 | 0.000 |
||
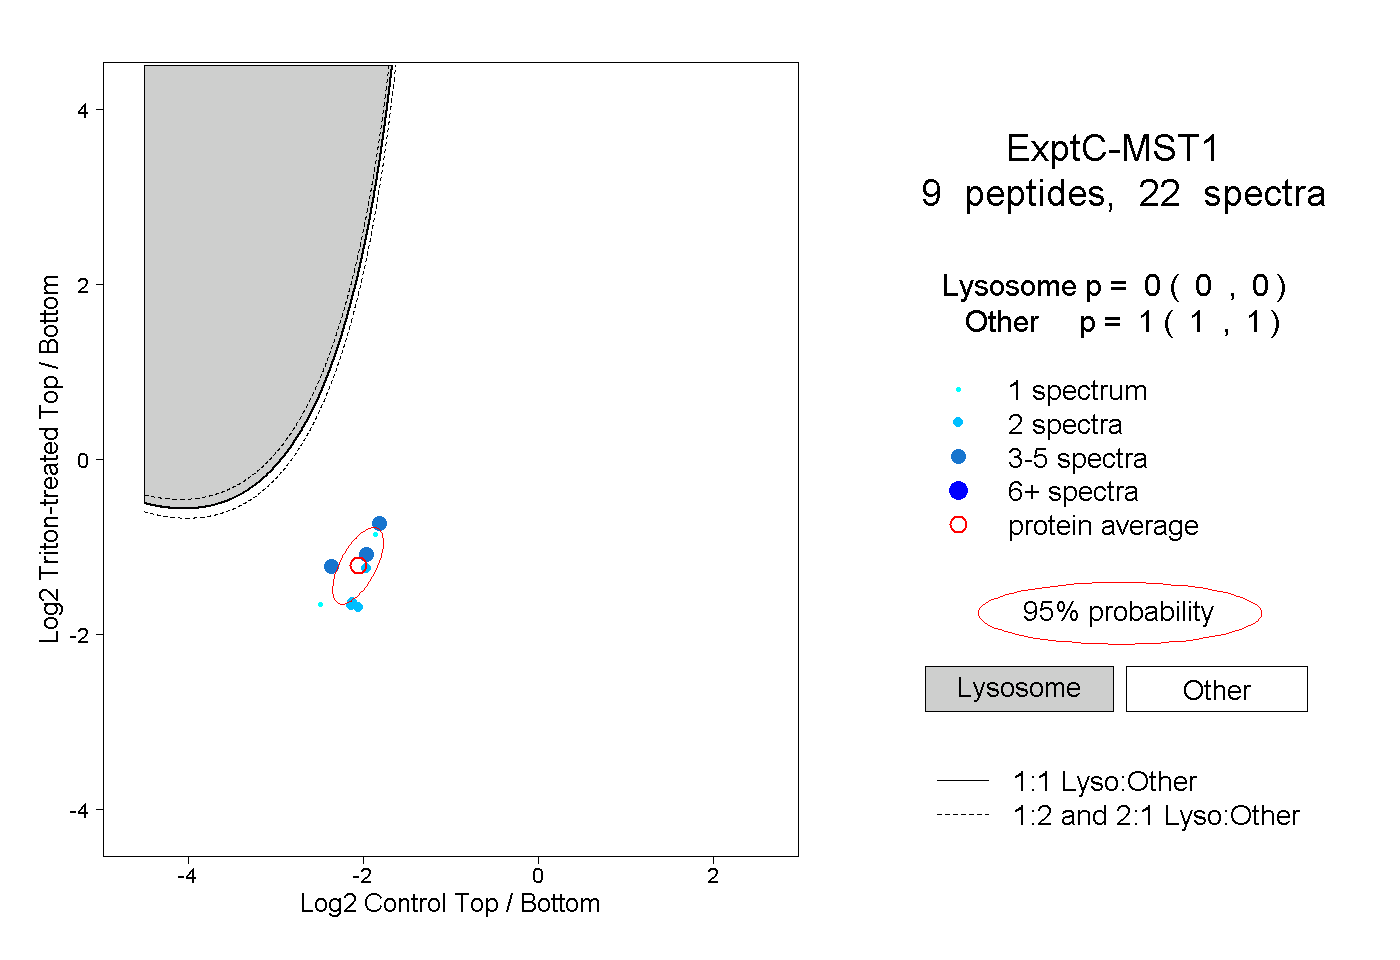
| Plot | Lyso | Other | |||||||||||
| Expt C |
9 peptides |
22 spectra |
|
0.000 0.000 | 0.000 |
1.000 1.000 | 1.000 |
| 1 spectrum, VISSQECNVK | 0.000 | 1.000 | ||||||||
| 5 spectra, GEVDVTESGR | 0.000 | 1.000 | ||||||||
| 2 spectra, NPDASERPWCYTTDPNVER | 0.000 | 1.000 | ||||||||
| 2 spectra, FQSCGIK | 0.000 | 1.000 | ||||||||
| 3 spectra, YTPTPK | 0.000 | 1.000 | ||||||||
| 2 spectra, SPLNDFQLLR | 0.000 | 1.000 | ||||||||
| 1 spectrum, VAFCYQIPR | 0.000 | 1.000 | ||||||||
| 2 spectra, ASNCFR | 0.000 | 1.000 | ||||||||
| 4 spectra, WPAIFTR | 0.000 | 1.000 |
| Plot | Lyso | Other | |||||||||||
| Expt D |
1 peptide |
2 spectra |
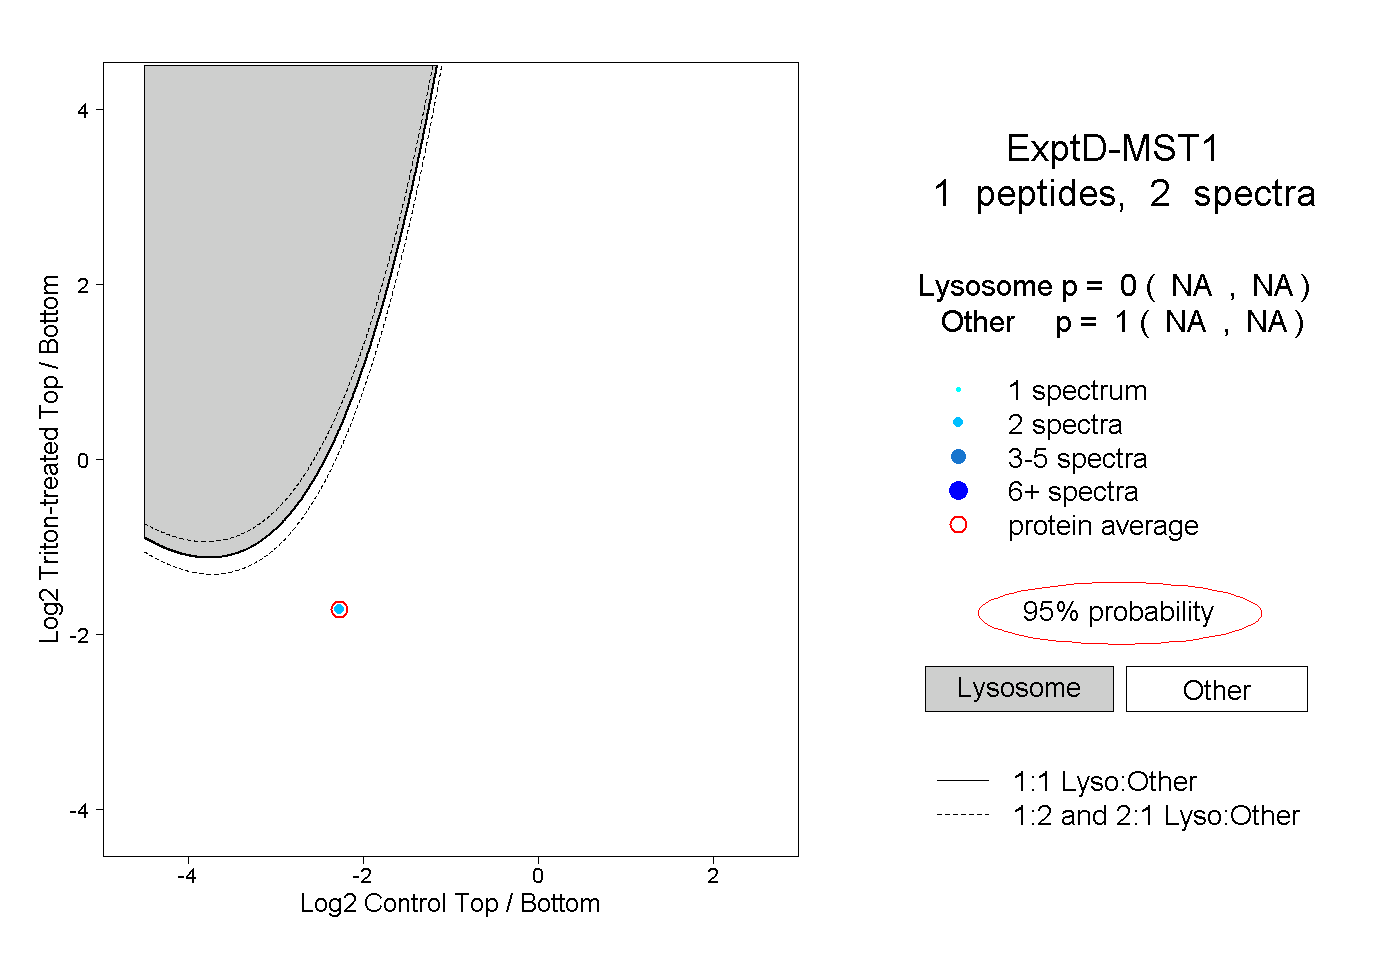 |
0.000 NA | NA |
1.000 NA | NA |