 21
21peptides
spectra
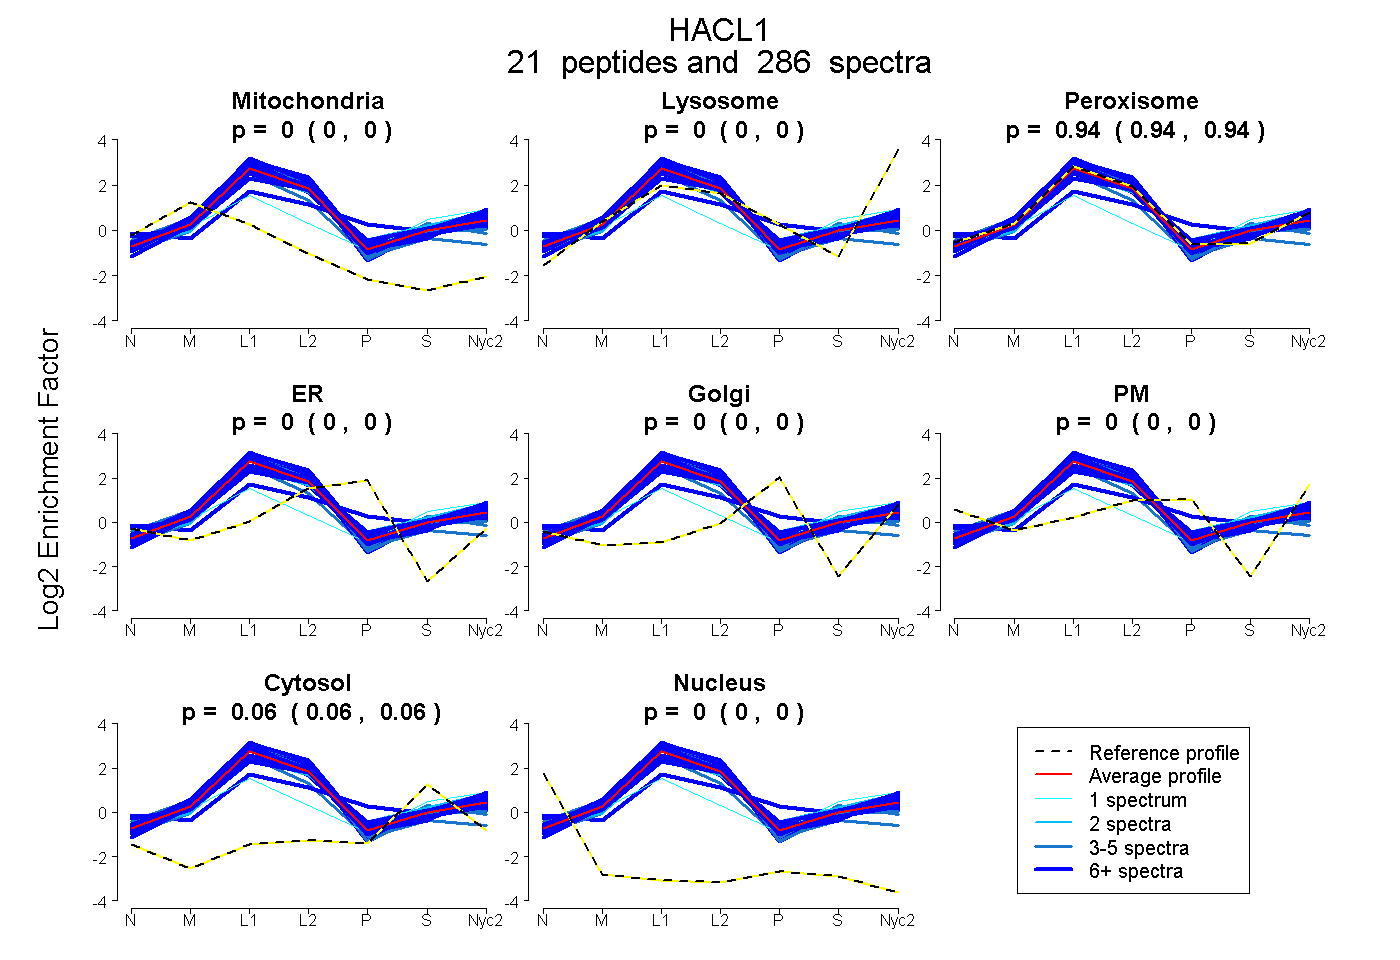
0.000 | 0.000
0.000 | 0.000
0.935 | 0.938
0.000 | 0.000
0.000 | 0.000
0.000 | 0.000
0.062 | 0.065
0.000 | 0.000
19peptides
spectra
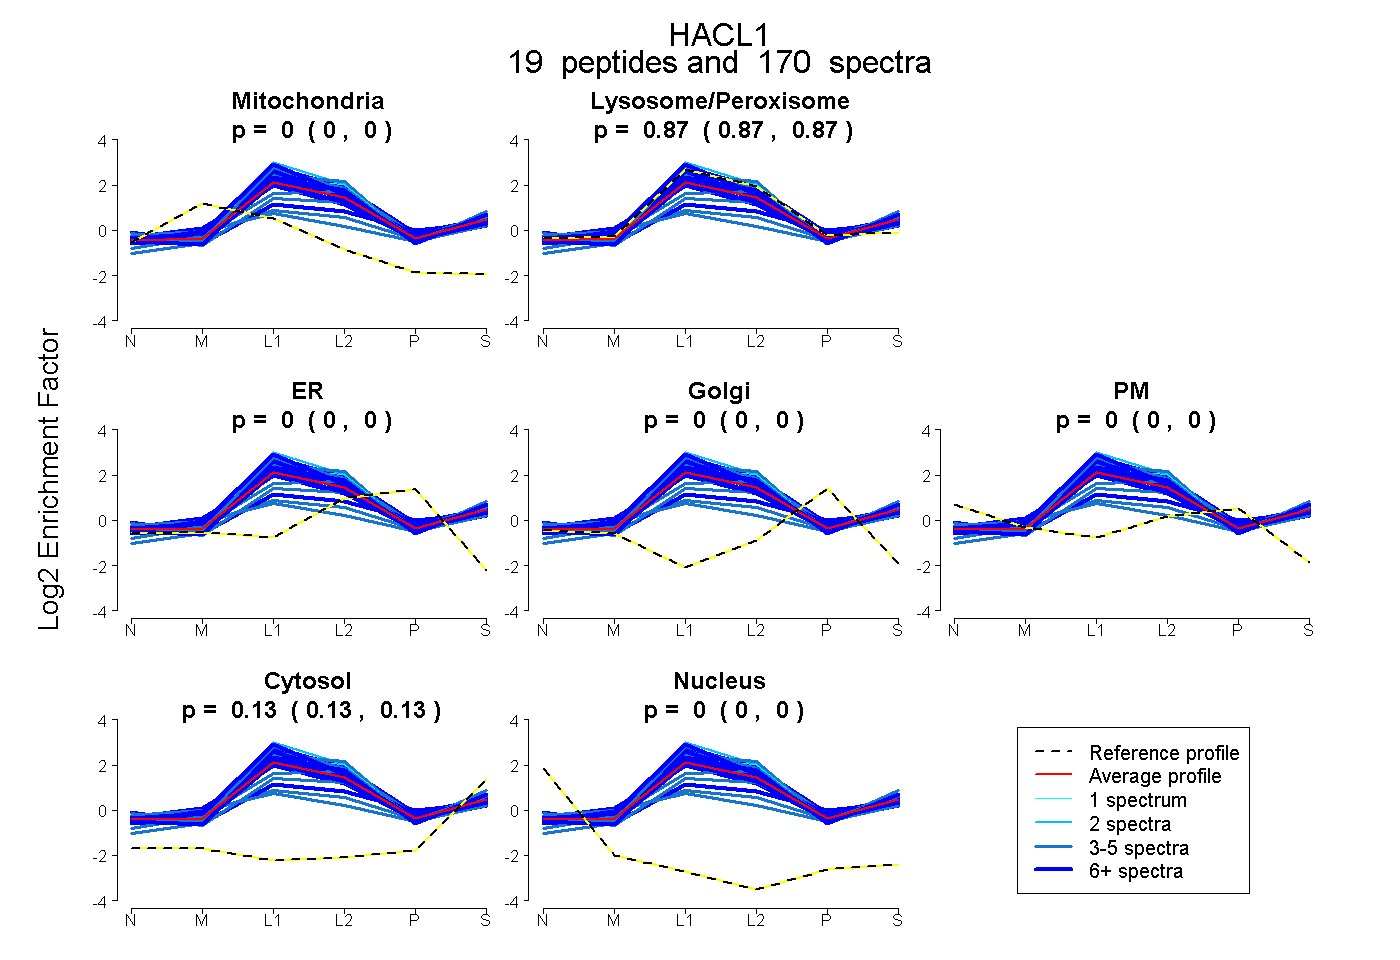
0.000 | 0.000
0.868 | 0.873
0.000 | 0.000
0.000 | 0.000
0.000 | 0.000
0.126 | 0.131
0.000 | 0.000
23peptides
spectra
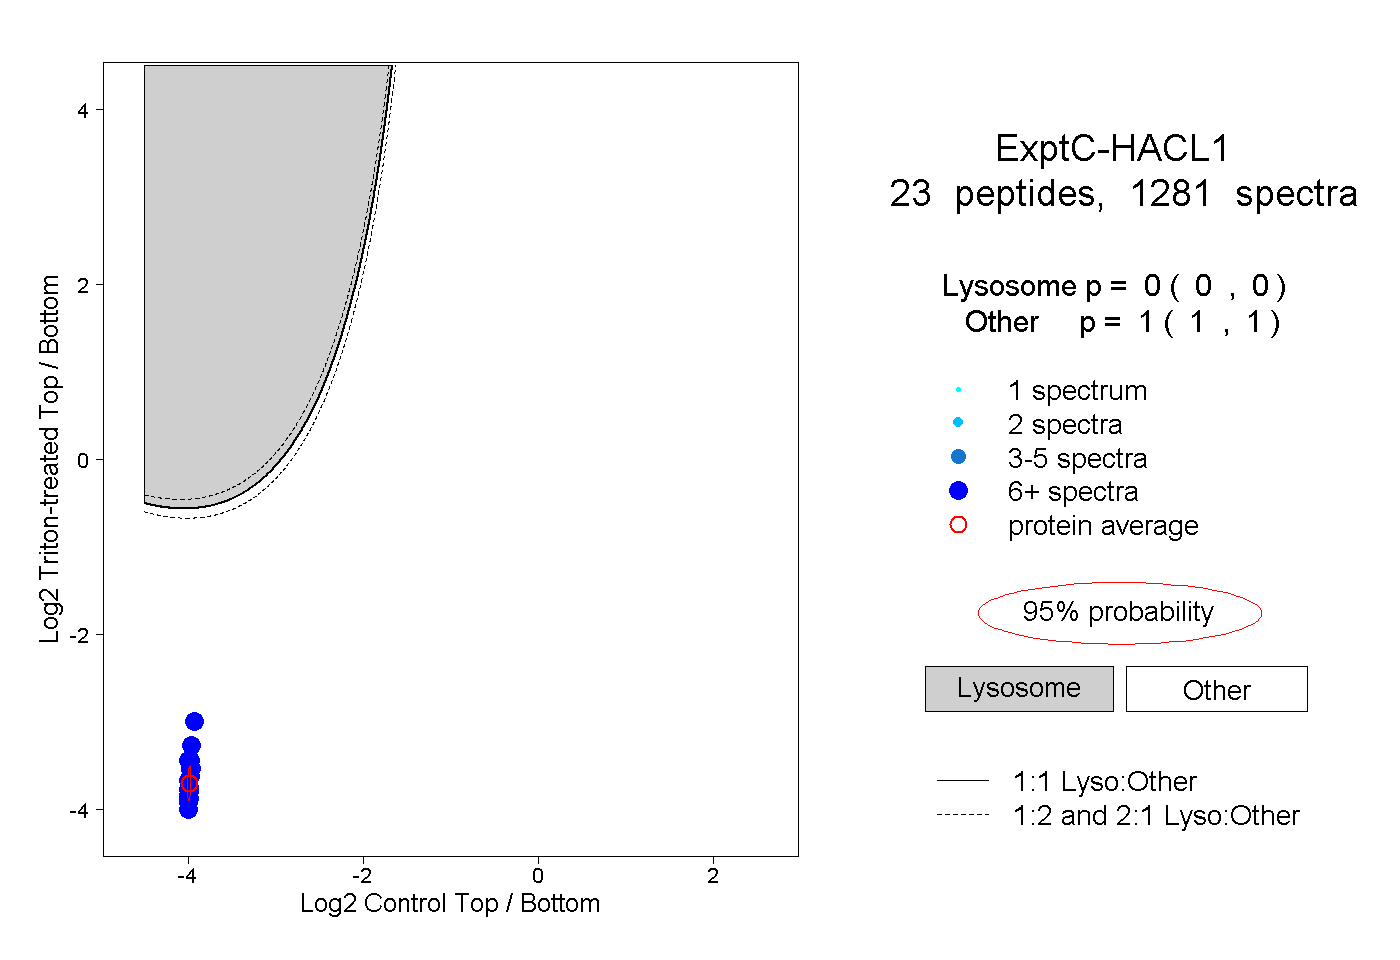
0.000 | 0.000
1.000 | 1.000
15peptides
spectra
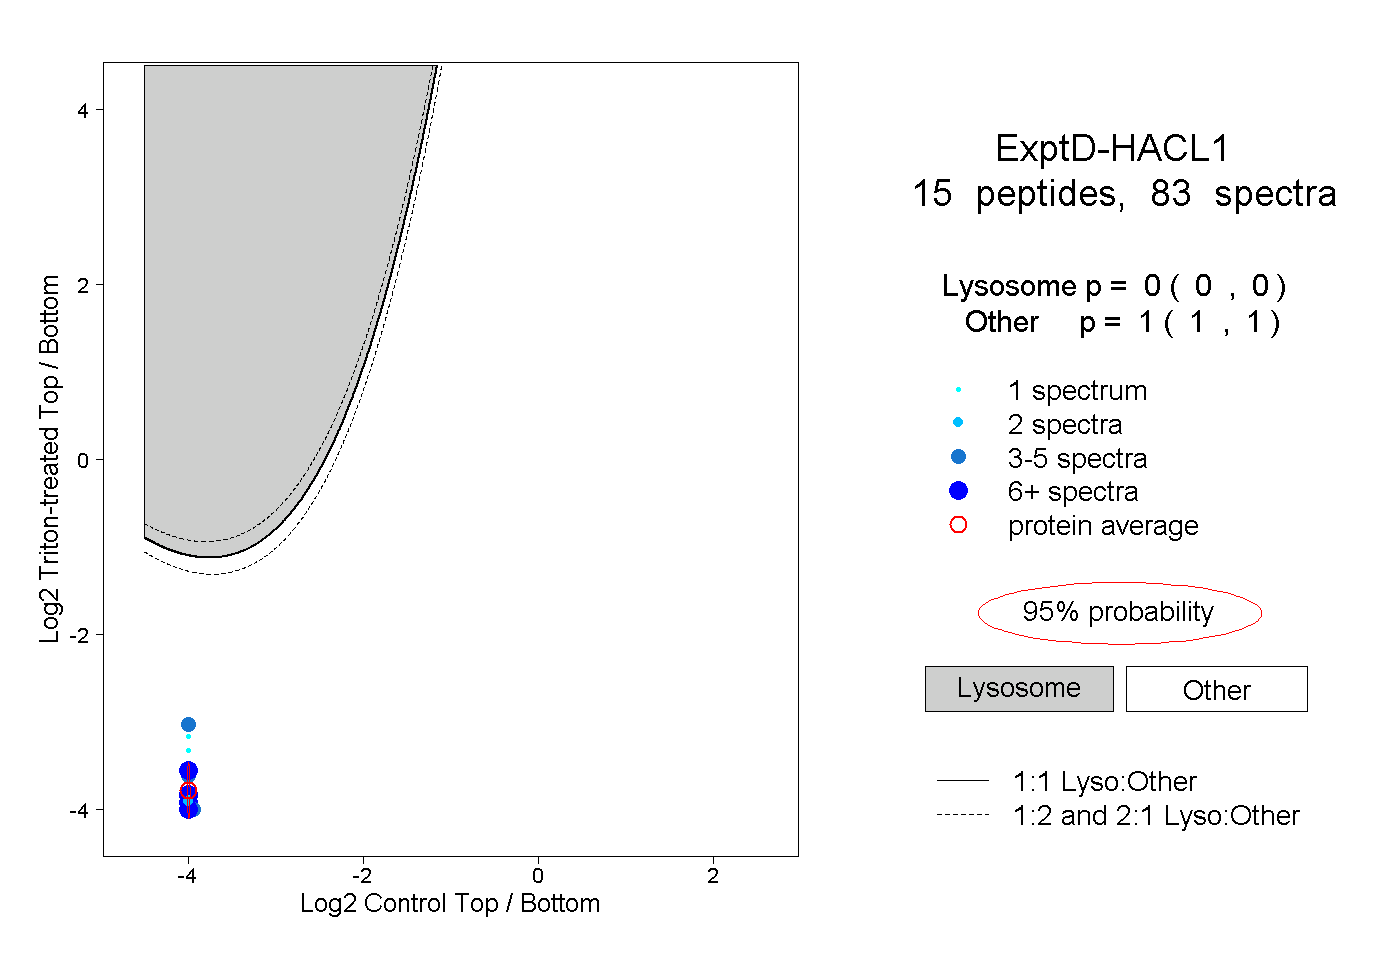
0.000 | 0.000
1.000 | 1.000