 21
21peptides
spectra
0.000 | 0.000
0.000 | 0.000
0.935 | 0.938
0.000 | 0.000
0.000 | 0.000
0.000 | 0.000
0.062 | 0.065
0.000 | 0.000
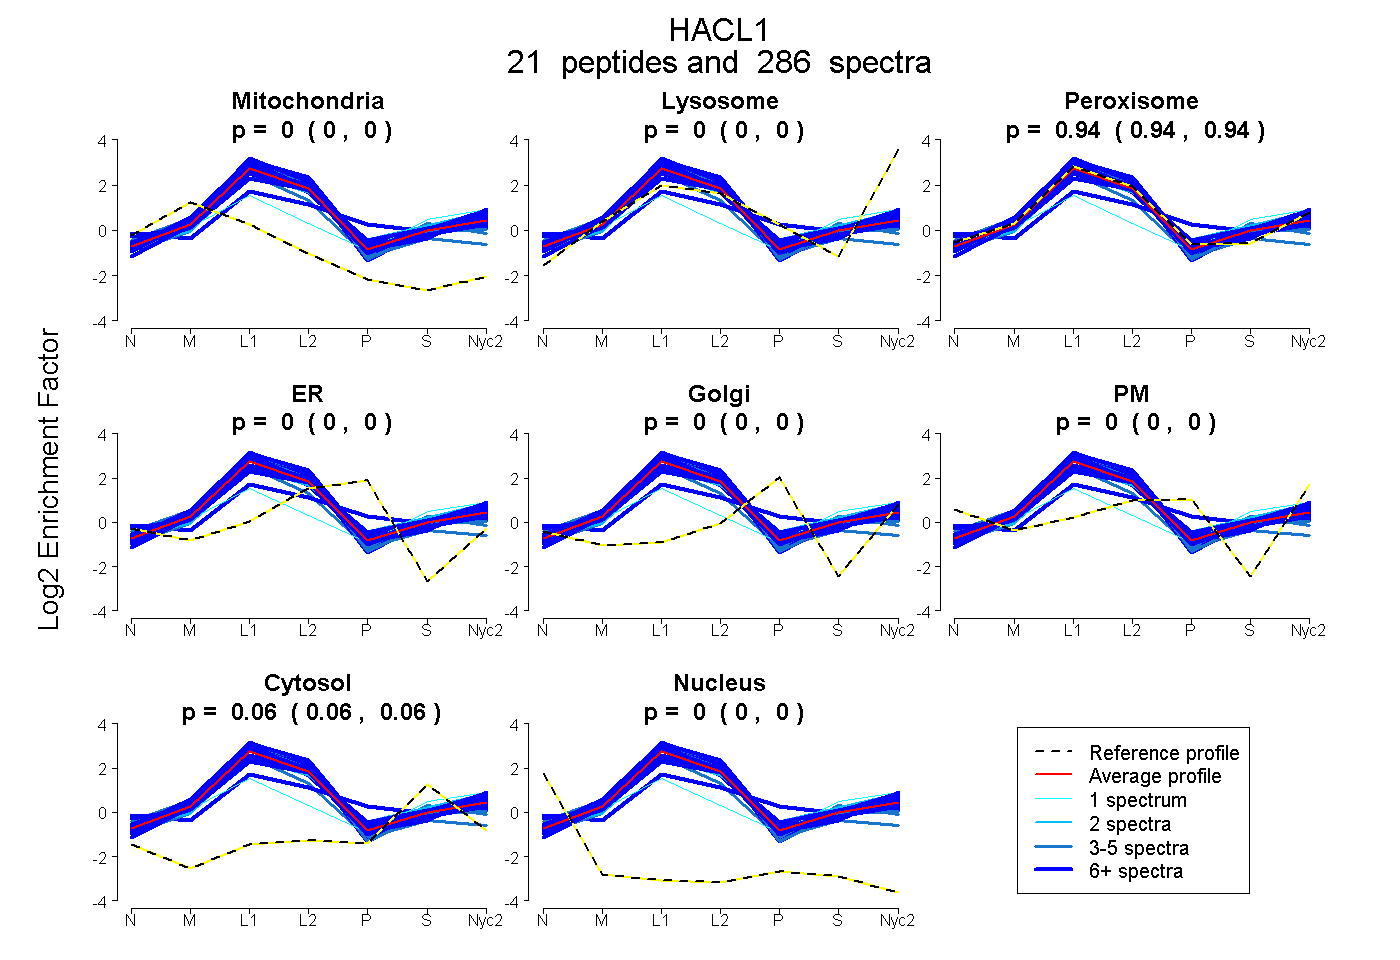
| Plot | Mito | Lyso | Perox | ER | Golgi | PM | Cytosol | Nucleus | |||||
| Expt A |
21 peptides |
286 spectra |
|
0.000 0.000 | 0.000 |
0.000 0.000 | 0.000 |
0.936 0.935 | 0.938 |
0.000 0.000 | 0.000 |
0.000 0.000 | 0.000 |
0.000 0.000 | 0.000 |
0.064 0.062 | 0.065 |
0.000 0.000 | 0.000 |
| 1 spectrum, SEEQVSGAK | 0.029 | 0.164 | 0.511 | 0.000 | 0.000 | 0.000 | 0.296 | 0.000 | ||
| 3 spectra, NQEAMGAFQEFPQVEACR | 0.019 | 0.000 | 0.981 | 0.000 | 0.000 | 0.000 | 0.000 | 0.000 | ||
| 6 spectra, ECCMPPPLSLAETSAVR | 0.000 | 0.000 | 0.912 | 0.000 | 0.000 | 0.000 | 0.088 | 0.000 | ||
| 8 spectra, QPLLIIGK | 0.000 | 0.000 | 0.969 | 0.000 | 0.000 | 0.000 | 0.031 | 0.000 | ||
| 34 spectra, AAASVLR | 0.000 | 0.000 | 0.977 | 0.000 | 0.000 | 0.000 | 0.023 | 0.000 | ||
| 13 spectra, GYFVQTPEELQDSLR | 0.000 | 0.000 | 0.953 | 0.000 | 0.000 | 0.000 | 0.047 | 0.000 | ||
| 3 spectra, DTSKPCLINIMIEPQSTR | 0.211 | 0.000 | 0.755 | 0.000 | 0.000 | 0.000 | 0.033 | 0.000 | ||
| 42 spectra, TVLQNYLPR | 0.000 | 0.000 | 0.964 | 0.000 | 0.000 | 0.000 | 0.036 | 0.000 | ||
| 2 spectra, NNEAVSK | 0.000 | 0.047 | 0.844 | 0.000 | 0.000 | 0.000 | 0.109 | 0.000 | ||
| 6 spectra, VIAQALK | 0.000 | 0.000 | 1.000 | 0.000 | 0.000 | 0.000 | 0.000 | 0.000 | ||
| 8 spectra, NPWQYPTDSK | 0.000 | 0.000 | 1.000 | 0.000 | 0.000 | 0.000 | 0.000 | 0.000 | ||
| 14 spectra, AQDFHWLTR | 0.000 | 0.000 | 0.954 | 0.000 | 0.000 | 0.000 | 0.046 | 0.000 | ||
| 1 spectrum, ALQFADVIVLFGAR | 0.000 | 0.000 | 0.949 | 0.000 | 0.000 | 0.000 | 0.051 | 0.000 | ||
| 49 spectra, GVVPDNHPNCVGAAR | 0.002 | 0.000 | 0.946 | 0.000 | 0.000 | 0.000 | 0.051 | 0.000 | ||
| 35 spectra, GAAYSHAEDSIR | 0.000 | 0.000 | 0.659 | 0.114 | 0.062 | 0.000 | 0.164 | 0.000 | ||
| 6 spectra, YQADVK | 0.000 | 0.000 | 0.899 | 0.000 | 0.000 | 0.000 | 0.079 | 0.021 | ||
| 22 spectra, WWETLR | 0.000 | 0.029 | 0.921 | 0.000 | 0.000 | 0.000 | 0.051 | 0.000 | ||
| 3 spectra, LVELCNLPFLPTPMGK | 0.000 | 0.000 | 0.919 | 0.000 | 0.000 | 0.000 | 0.081 | 0.000 | ||
| 14 spectra, SLPMNYYTVFYHVQEQLPR | 0.000 | 0.000 | 0.962 | 0.000 | 0.000 | 0.000 | 0.038 | 0.000 | ||
| 9 spectra, NCFIVSEGANTMDIGR | 0.035 | 0.000 | 0.904 | 0.000 | 0.000 | 0.000 | 0.061 | 0.000 | ||
| 7 spectra, QLLEQFVK | 0.010 | 0.000 | 0.935 | 0.000 | 0.000 | 0.000 | 0.055 | 0.000 |
| Plot | Mito | Lyso or Perox | ER | Golgi | PM | Cytosol | Nucleus | ||||||
| Expt B |
19 peptides |
170 spectra |
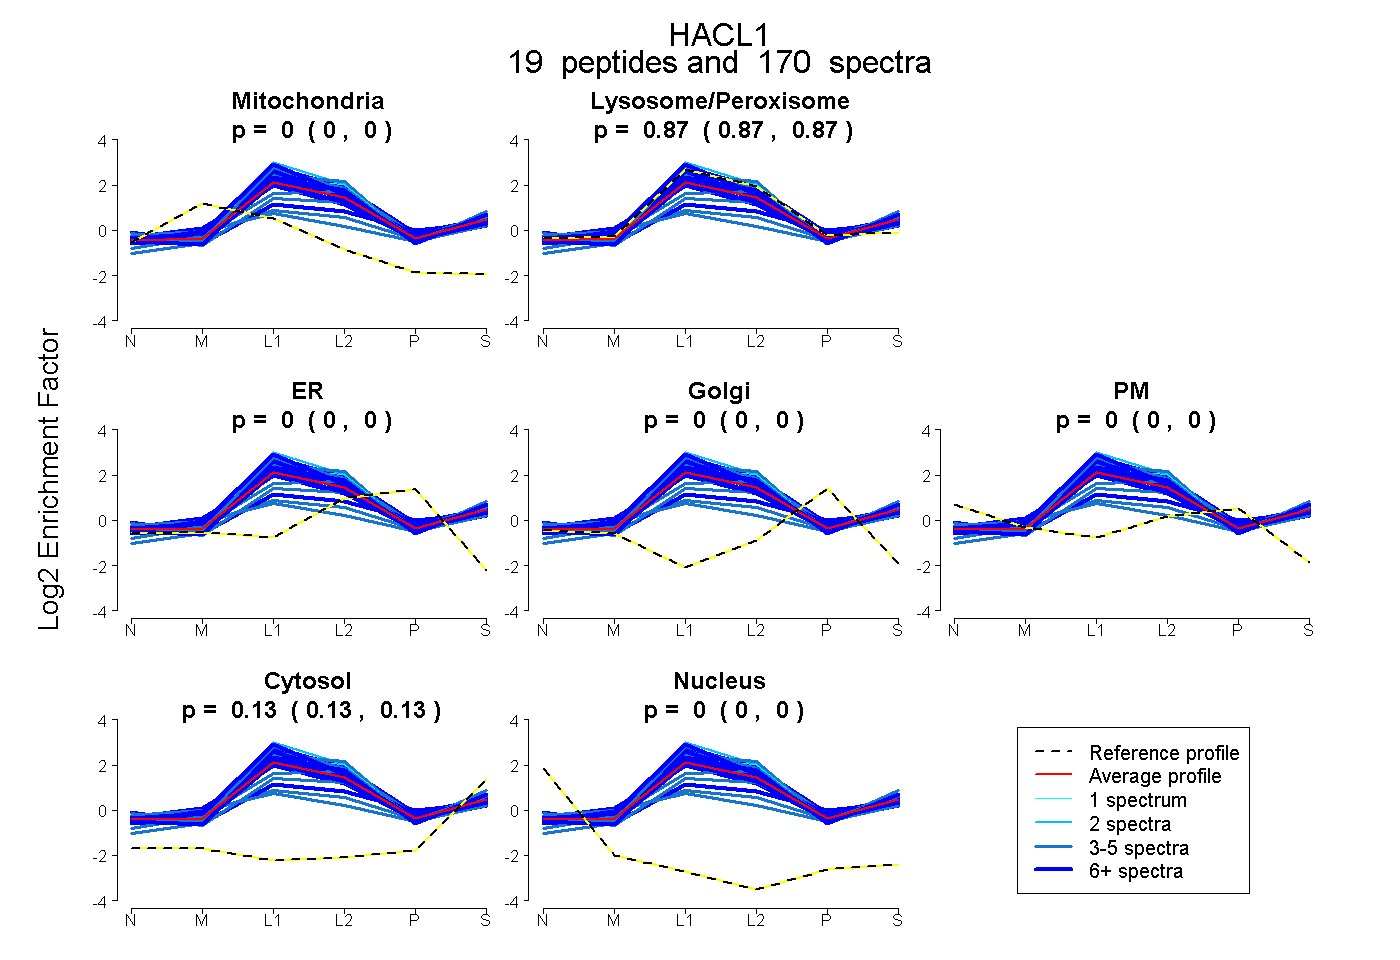 |
0.000 0.000 | 0.000 |
0.871 0.868 | 0.873 |
0.000 0.000 | 0.000 |
0.000 0.000 | 0.000 |
0.000 0.000 | 0.000 |
0.129 0.126 | 0.131 |
0.000 0.000 | 0.000 |
|||
| Plot | Lyso | Other | |||||||||||
| Expt C |
23 peptides |
1281 spectra |
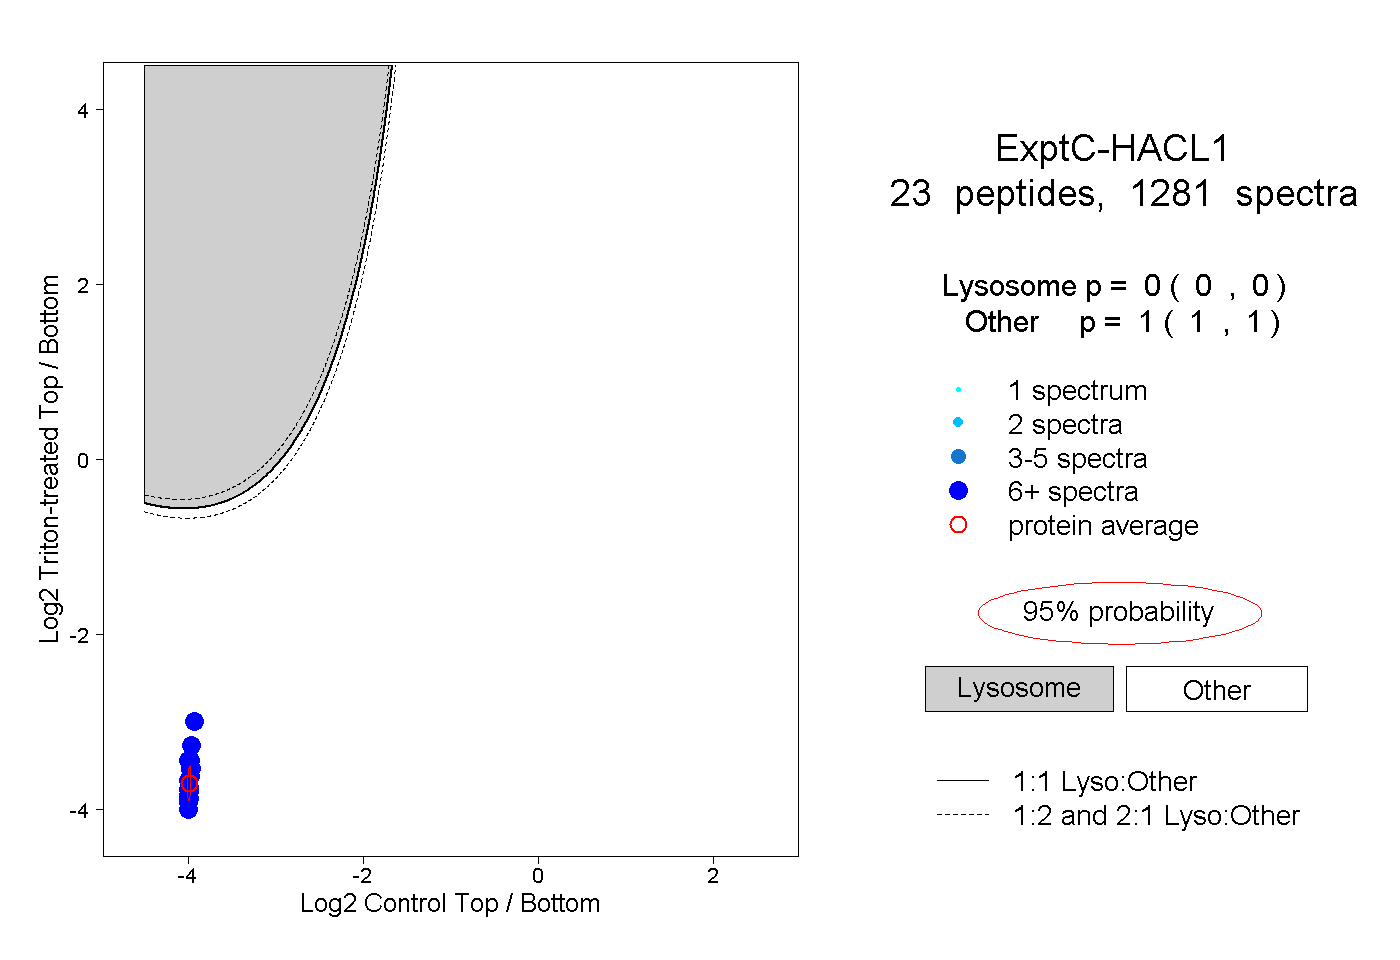 |
0.000 0.000 | 0.000 |
1.000 1.000 | 1.000 |
||||||||
| Plot | Lyso | Other | |||||||||||
| Expt D |
15 peptides |
83 spectra |
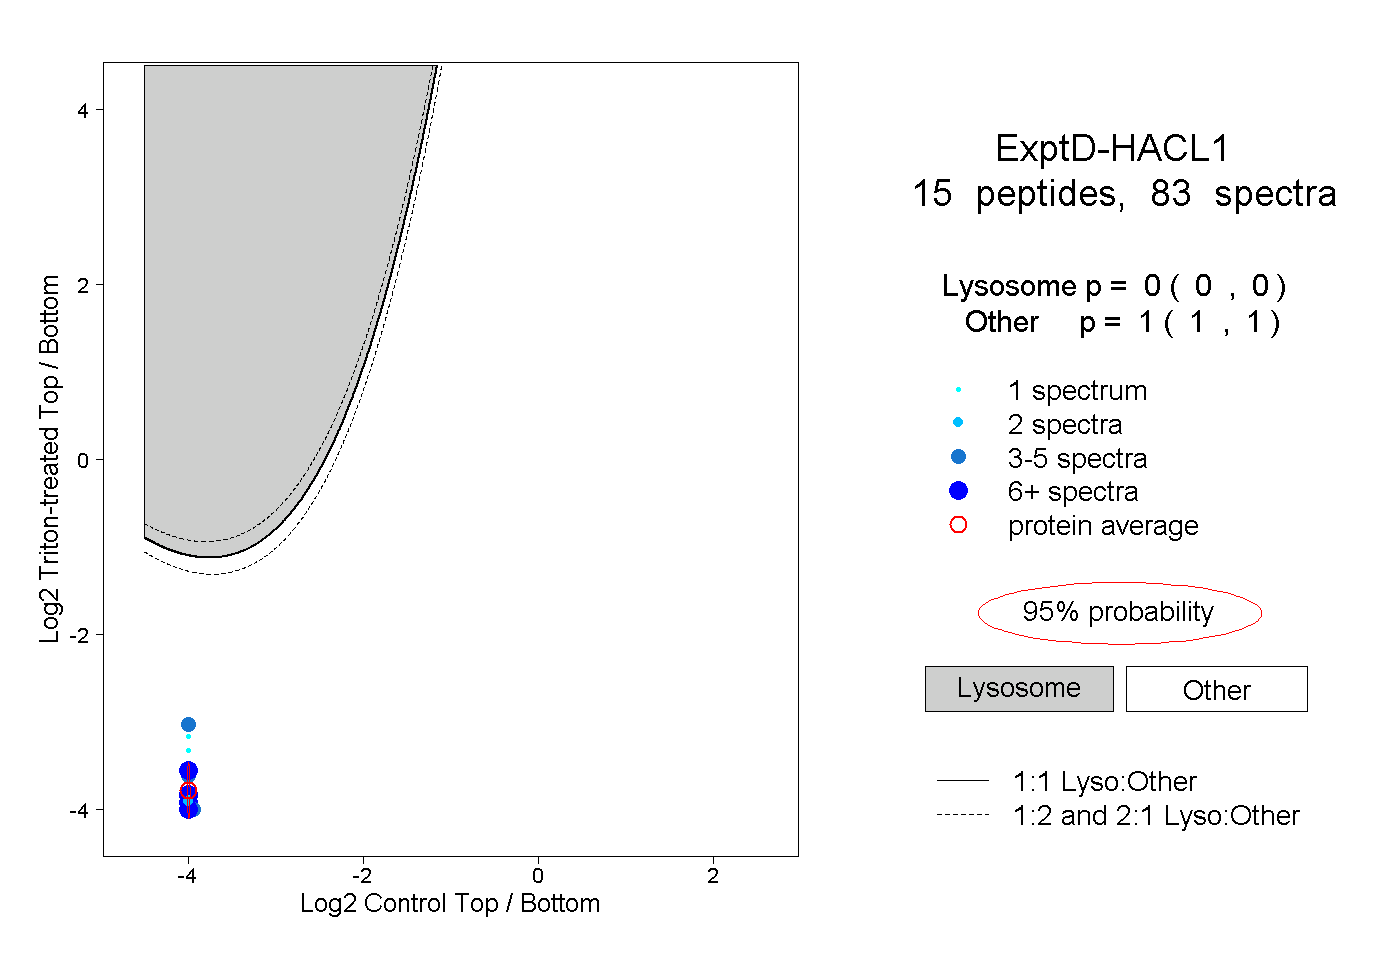 |
0.000 0.000 | 0.000 |
1.000 1.000 | 1.000 |