 10
10peptides
spectra
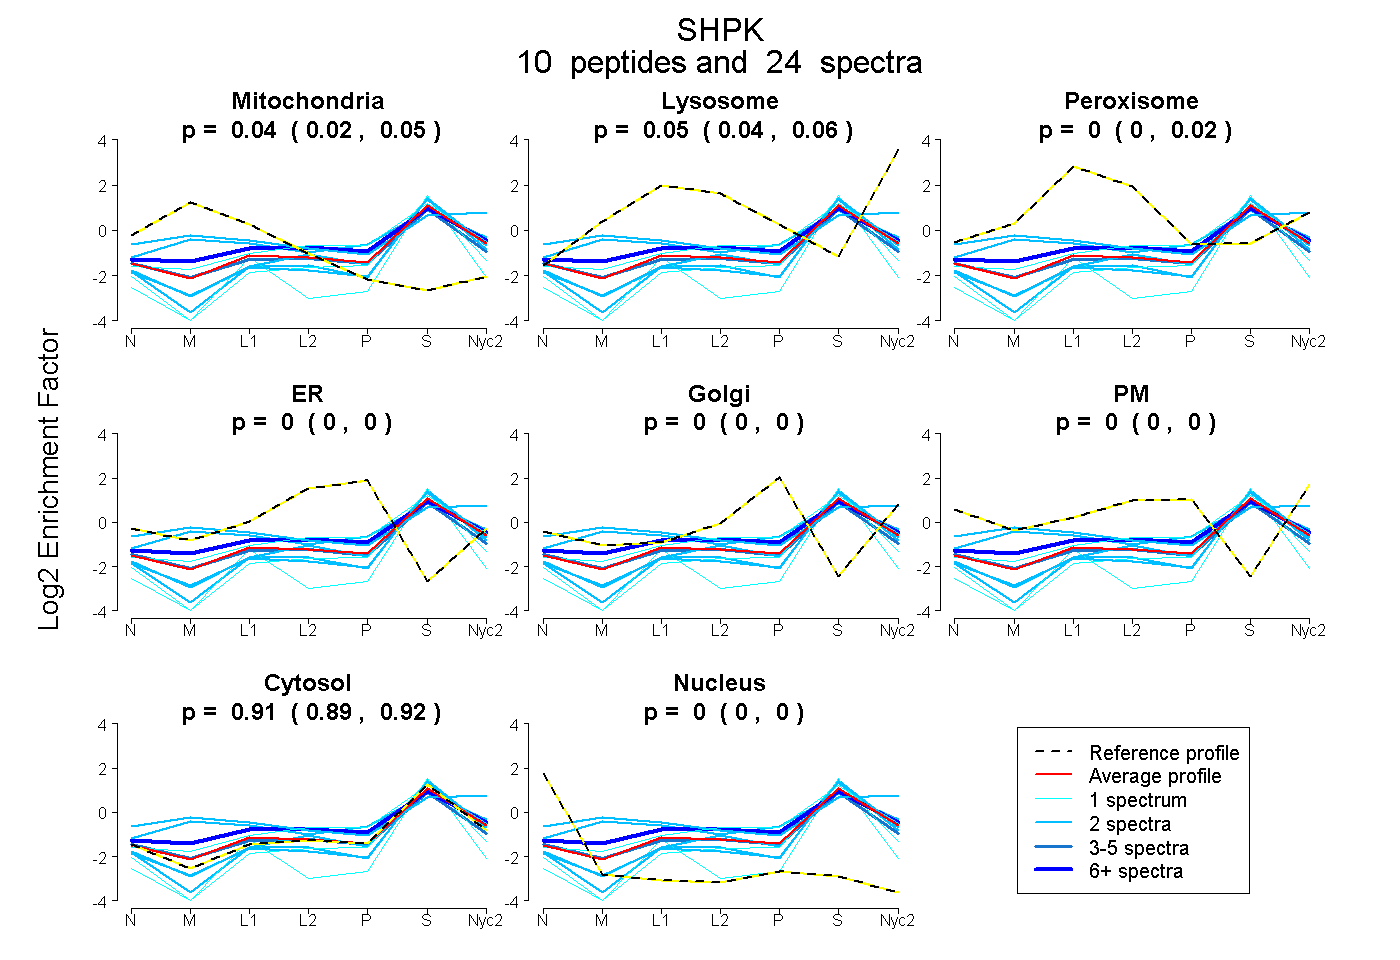
0.018 | 0.054
0.035 | 0.062
0.000 | 0.015
0.000 | 0.000
0.000 | 0.000
0.000 | 0.000
0.889 | 0.923
0.000 | 0.000
3peptides
spectra
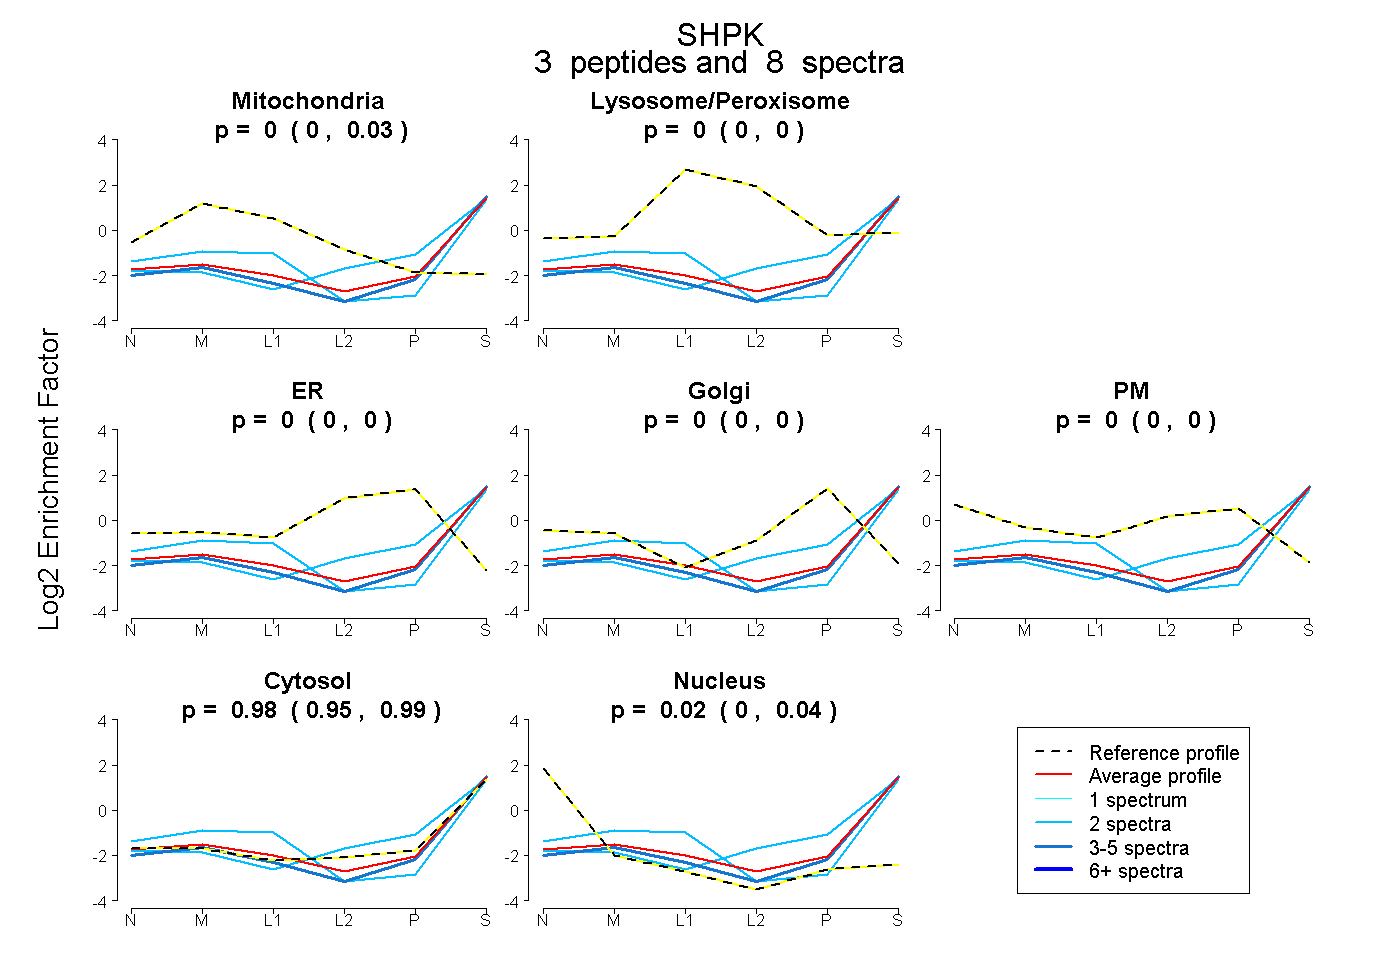
0.000 | 0.032
0.000 | 0.000
0.000 | 0.000
0.000 | 0.000
0.000 | 0.000
0.951 | 0.992
0.000 | 0.042
7peptides
spectra
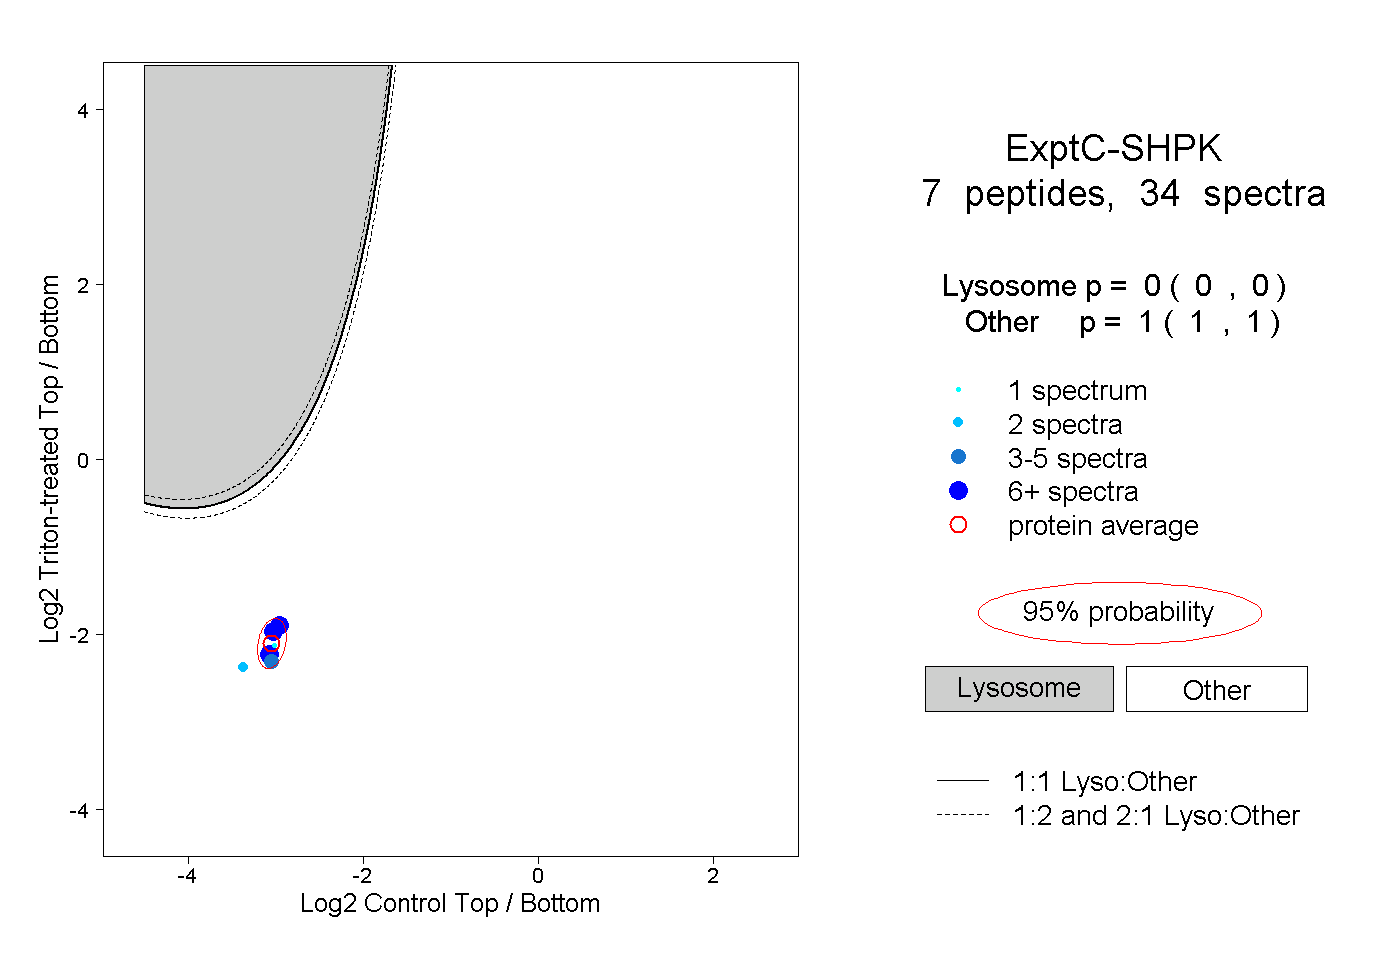
0.000 | 0.000
1.000 | 1.000
1peptide
spectra
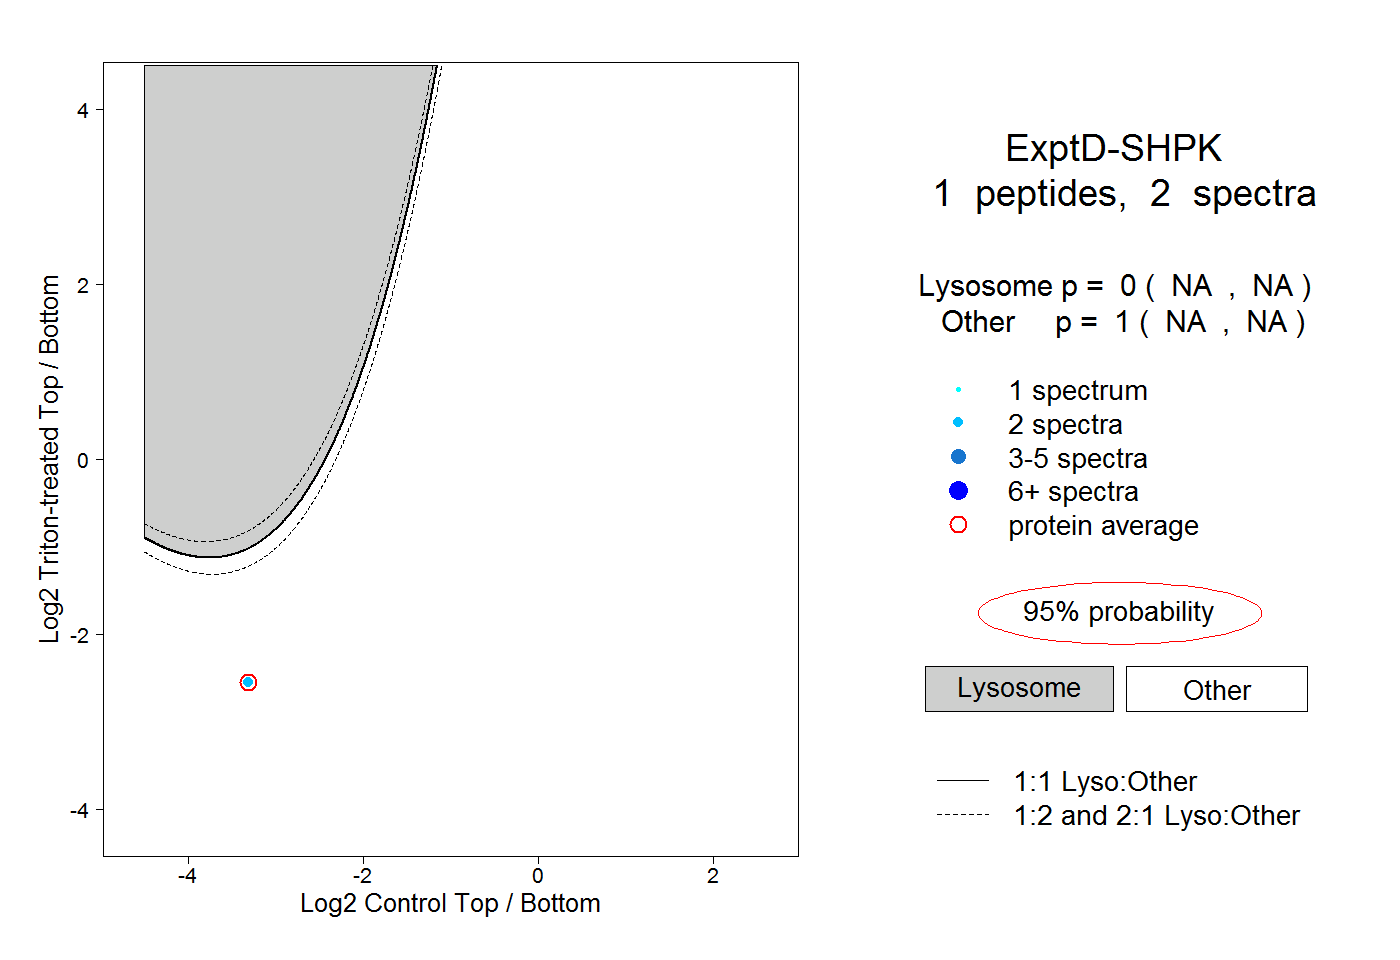
NA | NA
NA | NA