 7
7peptides
spectra
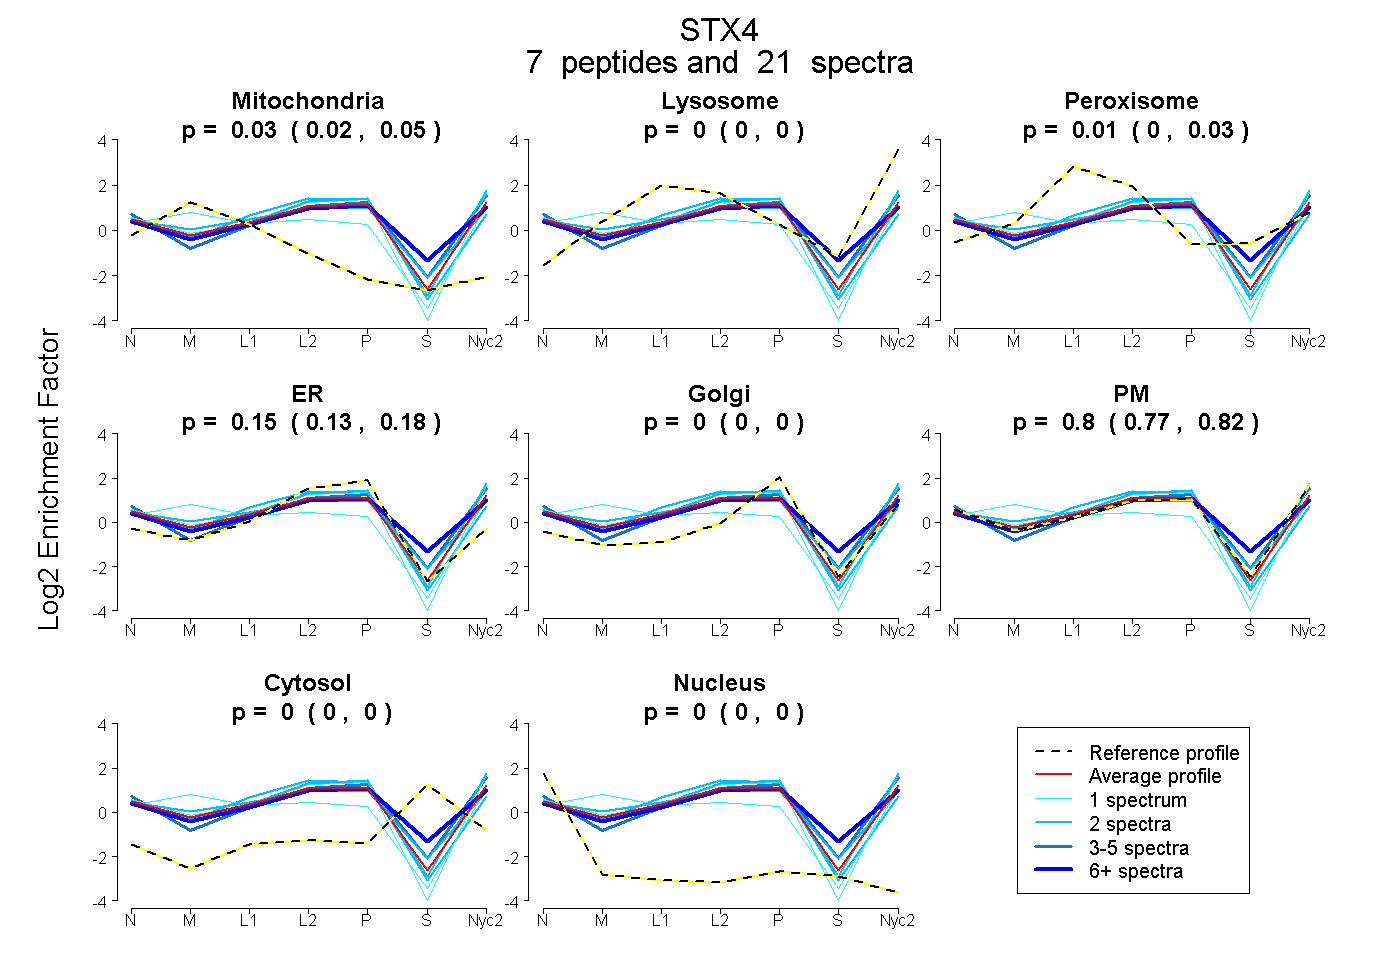
0.022 | 0.046
0.000 | 0.000
0.000 | 0.033
0.130 | 0.177
0.000 | 0.000
0.768 | 0.819
0.000 | 0.000
0.000 | 0.000
2peptides
spectra
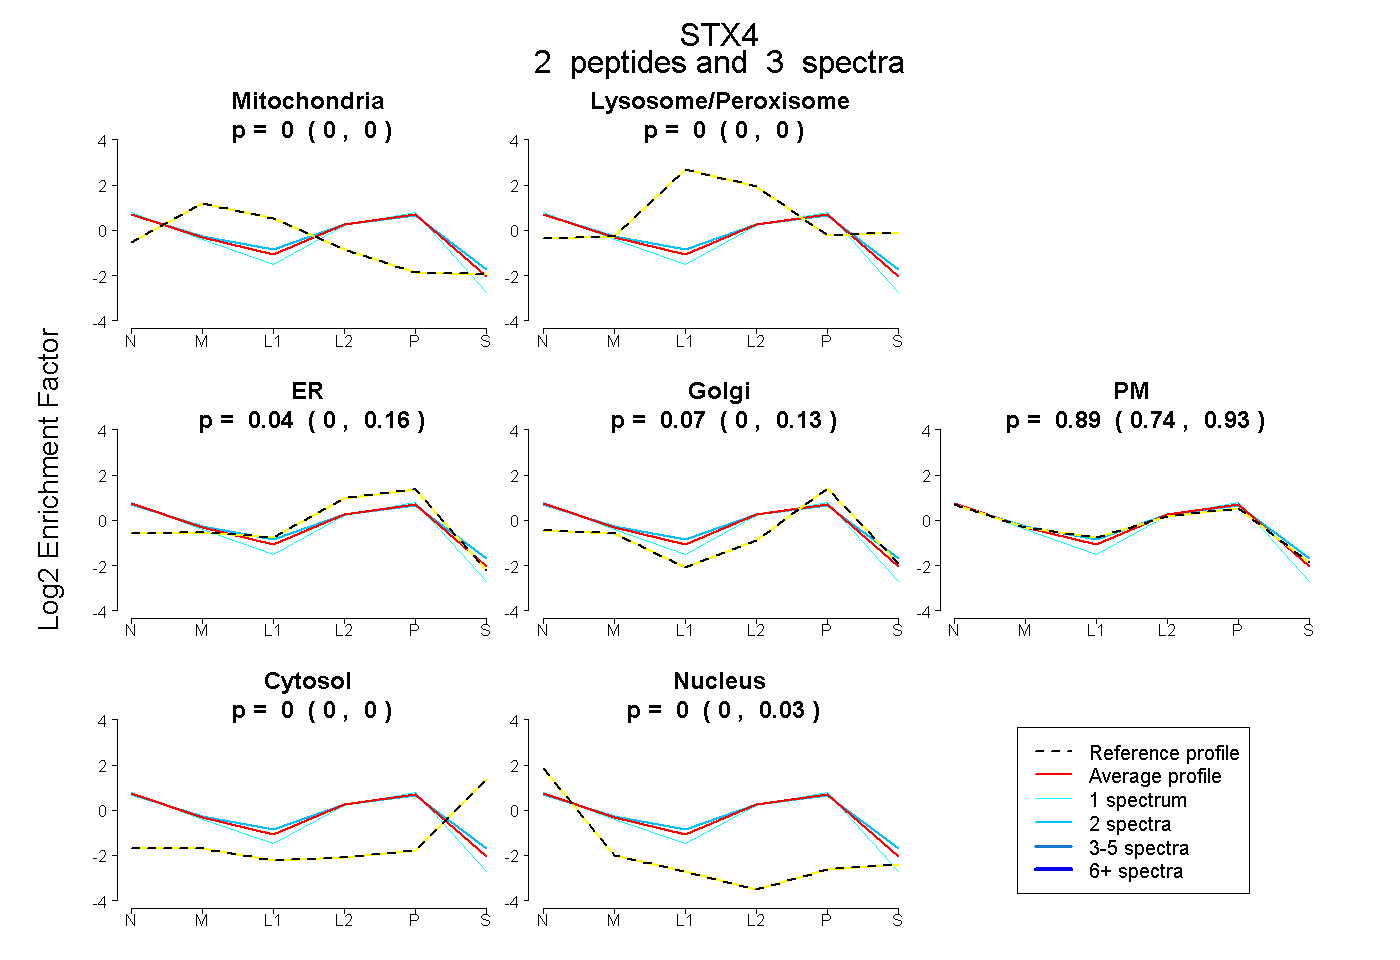
0.000 | 0.000
0.000 | 0.000
0.000 | 0.162
0.000 | 0.135
0.737 | 0.934
0.000 | 0.000
0.000 | 0.033
8peptides
spectra

0.000 | 0.000
1.000 | 1.000
3peptides
spectra
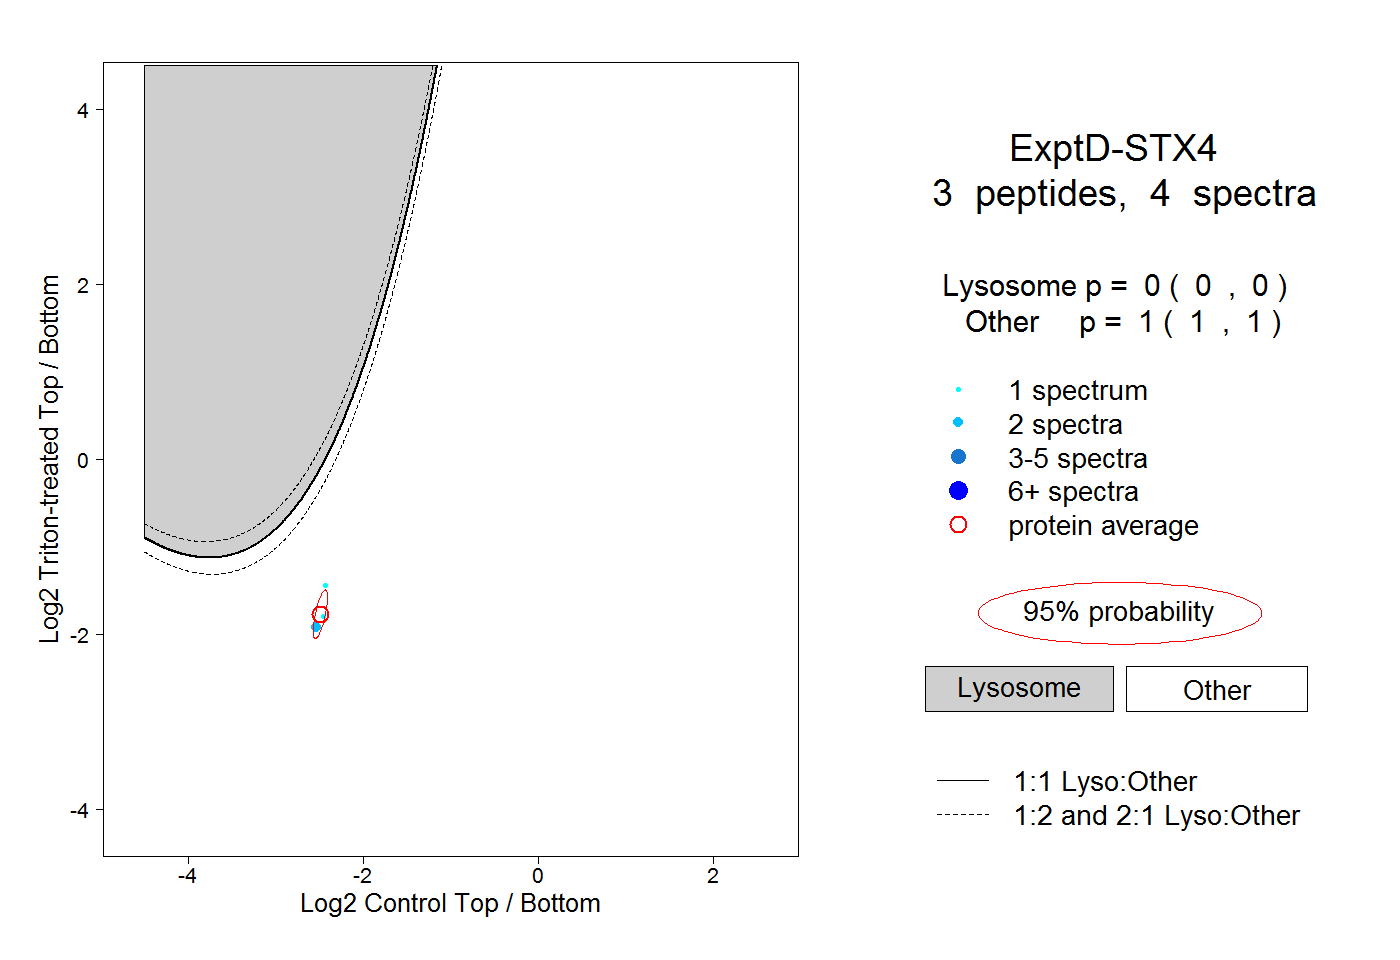
0.000 | 0.000
1.000 | 1.000