 7
7peptides
spectra
0.022 | 0.046
0.000 | 0.000
0.000 | 0.033
0.130 | 0.177
0.000 | 0.000
0.768 | 0.819
0.000 | 0.000
0.000 | 0.000
| Plot | Mito | Lyso | Perox | ER | Golgi | PM | Cytosol | Nucleus | |||||
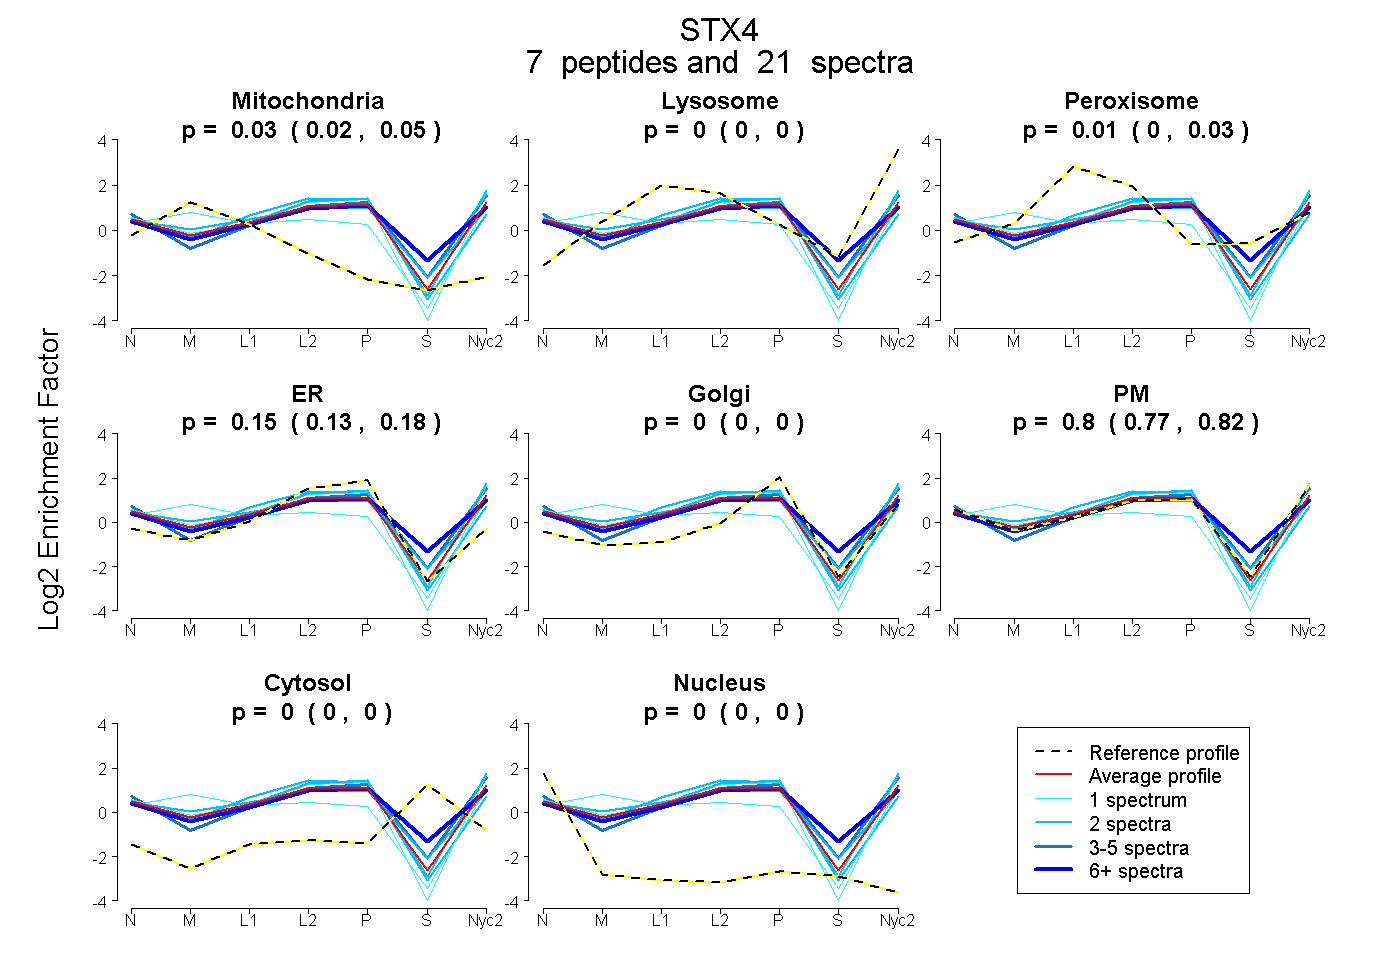
| Expt A |
7 peptides |
21 spectra |
|
0.034 0.022 | 0.046 |
0.000 0.000 | 0.000 |
0.014 0.000 | 0.033 |
0.154 0.130 | 0.177 |
0.000 0.000 | 0.000 |
0.797 0.768 | 0.819 |
0.000 0.000 | 0.000 |
0.000 0.000 | 0.000 |
| 1 spectrum, NILSSADYVER | 0.258 | 0.021 | 0.000 | 0.000 | 0.000 | 0.721 | 0.000 | 0.000 | ||
| 4 spectra, GQEHVK | 0.000 | 0.000 | 0.000 | 0.062 | 0.000 | 0.903 | 0.035 | 0.000 | ||
| 2 spectra, QGLQNLR | 0.000 | 0.030 | 0.000 | 0.112 | 0.000 | 0.858 | 0.000 | 0.000 | ||
| 1 spectrum, HSEIQQLER | 0.000 | 0.000 | 0.000 | 0.108 | 0.000 | 0.892 | 0.000 | 0.000 | ||
| 9 spectra, VALVVHSGAAR | 0.000 | 0.000 | 0.128 | 0.127 | 0.026 | 0.610 | 0.108 | 0.000 | ||
| 2 spectra, CNSMQSEYR | 0.008 | 0.000 | 0.030 | 0.418 | 0.000 | 0.543 | 0.000 | 0.000 | ||
| 2 spectra, QALNEISAR | 0.071 | 0.000 | 0.108 | 0.153 | 0.004 | 0.664 | 0.000 | 0.000 |
| Plot | Mito | Lyso or Perox | ER | Golgi | PM | Cytosol | Nucleus | ||||||
| Expt B |
2 peptides |
3 spectra |
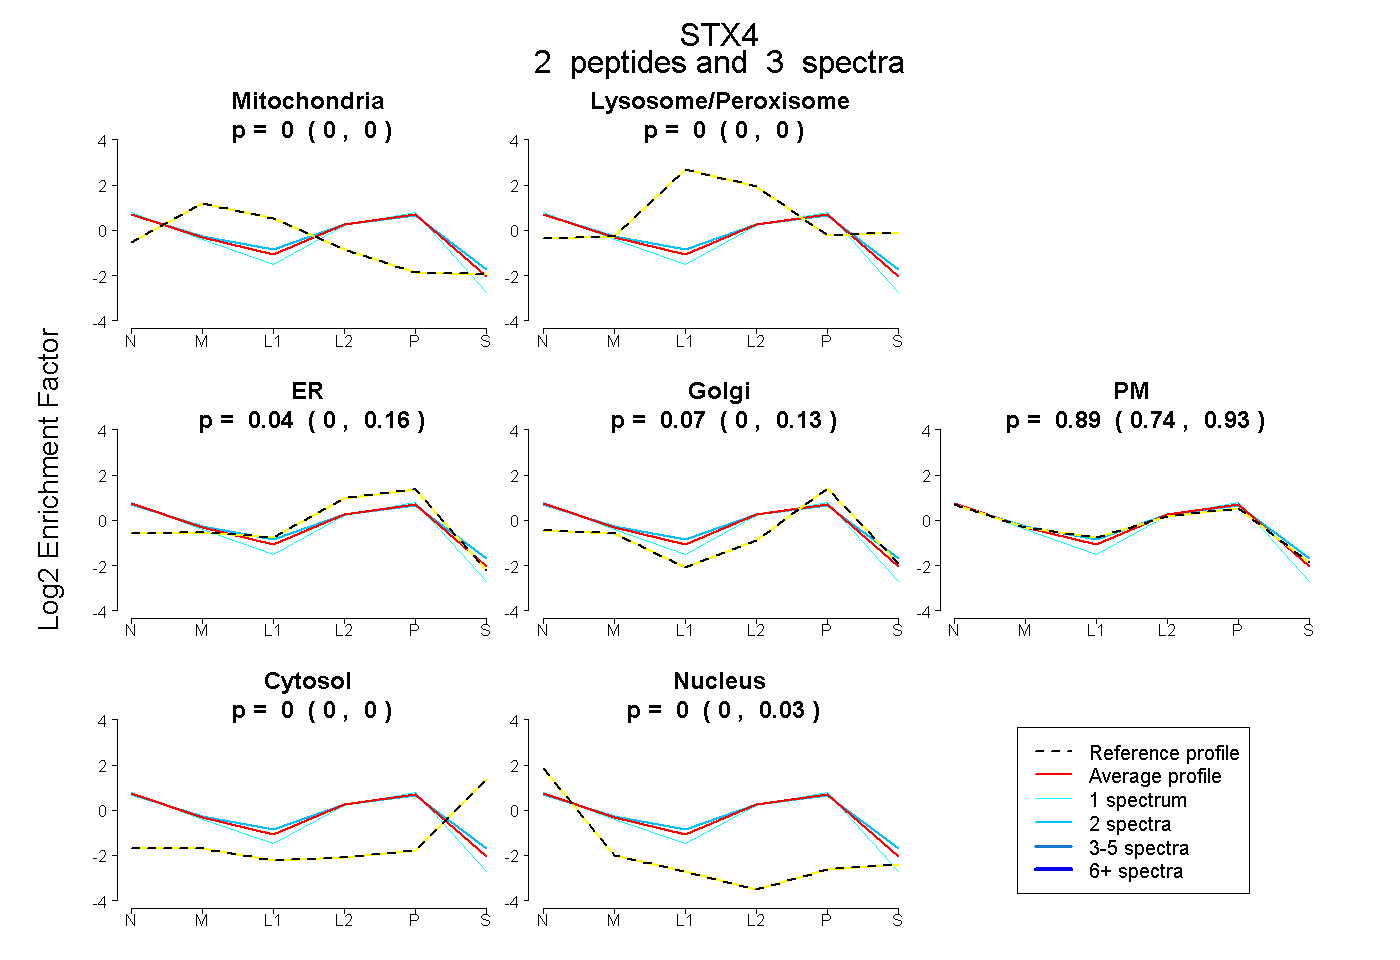 |
0.000 0.000 | 0.000 |
0.000 0.000 | 0.000 |
0.042 0.000 | 0.162 |
0.069 0.000 | 0.135 |
0.889 0.737 | 0.934 |
0.000 0.000 | 0.000 |
0.000 0.000 | 0.033 |
|||
| Plot | Lyso | Other | |||||||||||
| Expt C |
8 peptides |
28 spectra |
 |
0.000 0.000 | 0.000 |
1.000 1.000 | 1.000 |
||||||||
| Plot | Lyso | Other | |||||||||||
| Expt D |
3 peptides |
4 spectra |
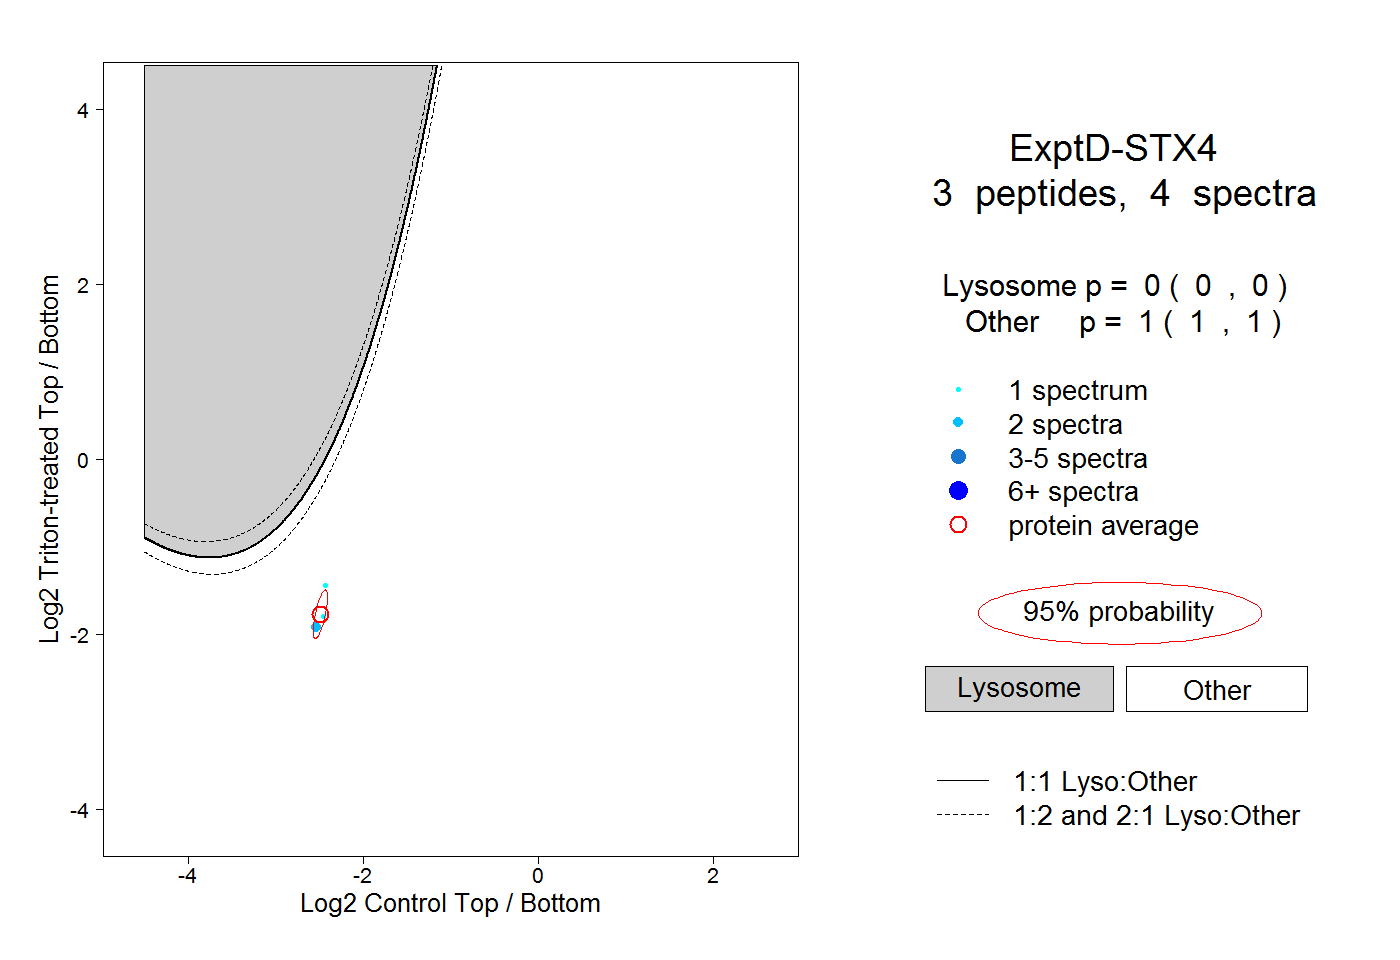 |
0.000 0.000 | 0.000 |
1.000 1.000 | 1.000 |