 15
15peptides
spectra
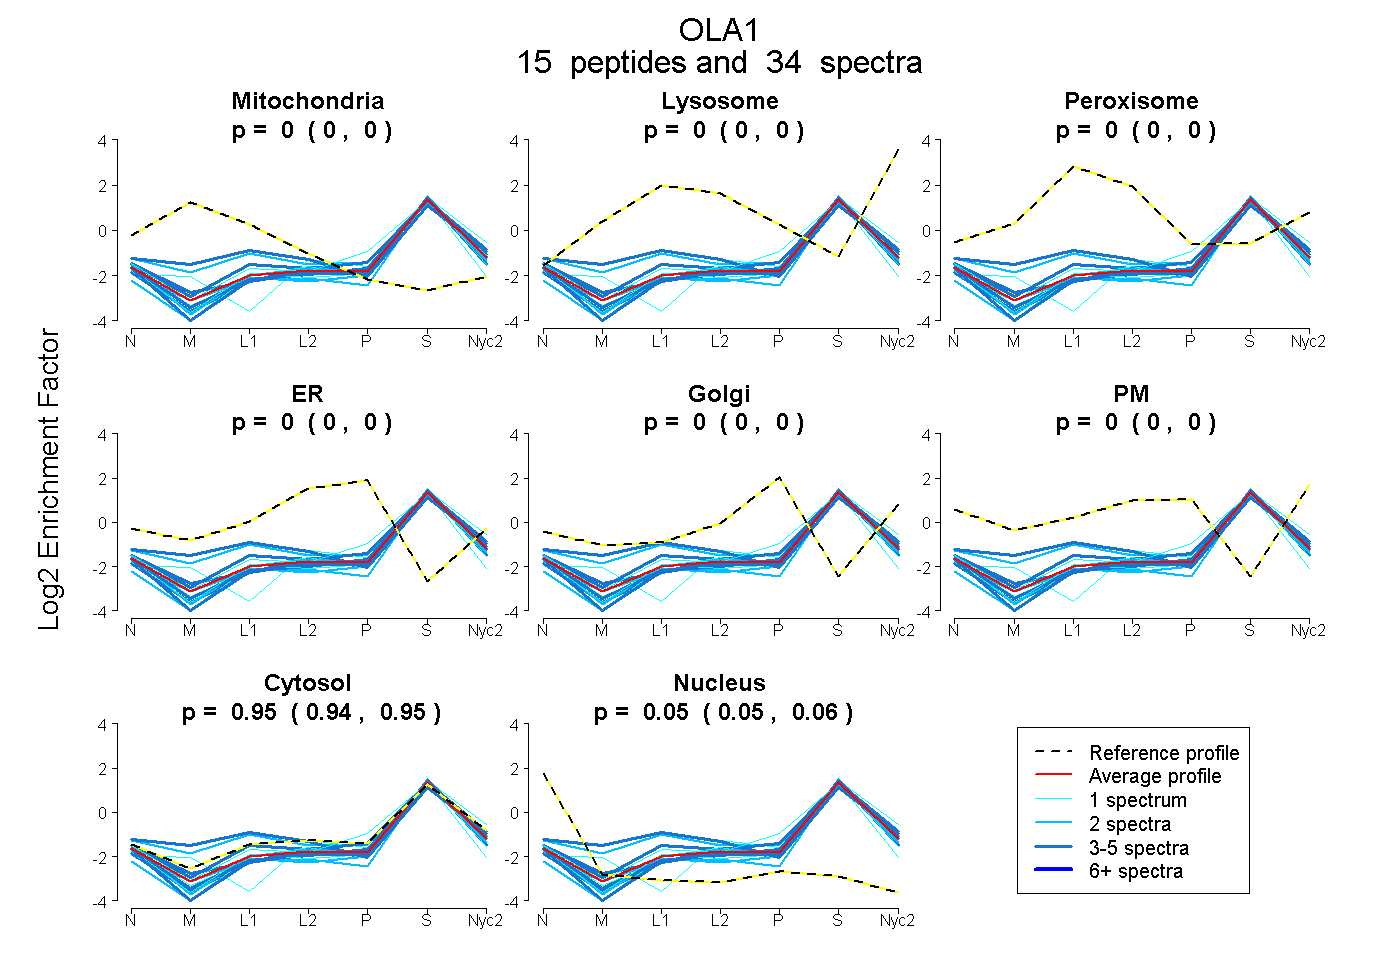
0.000 | 0.000
0.000 | 0.000
0.000 | 0.000
0.000 | 0.000
0.000 | 0.000
0.000 | 0.000
0.942 | 0.948
0.051 | 0.057
5peptides
spectra
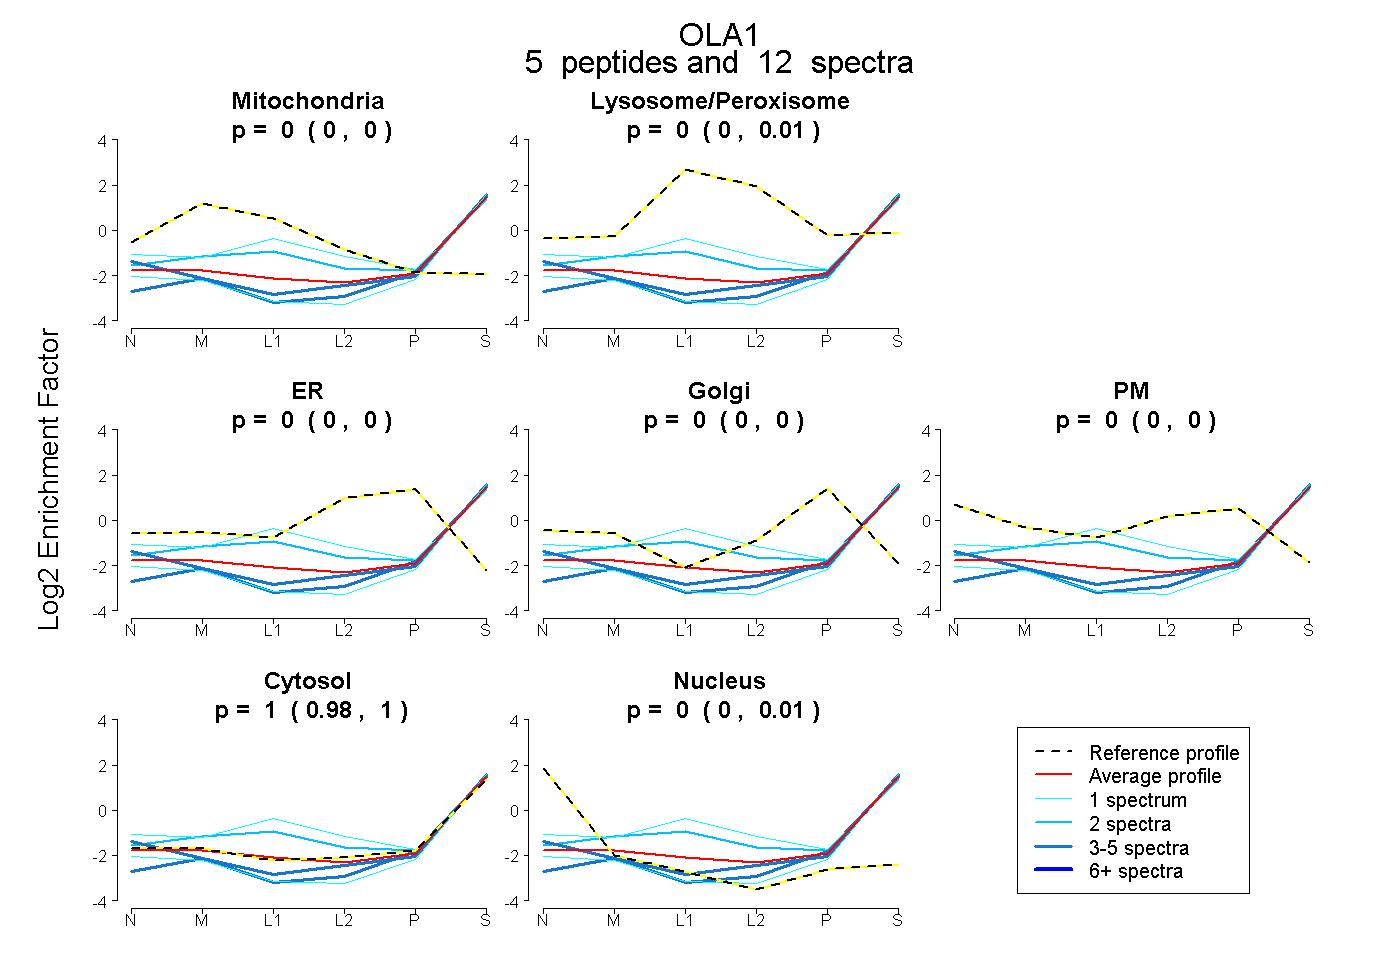
0.000 | 0.000
0.000 | 0.014
0.000 | 0.000
0.000 | 0.000
0.000 | 0.000
0.975 | 1.000
0.000 | 0.011
10peptides
spectra
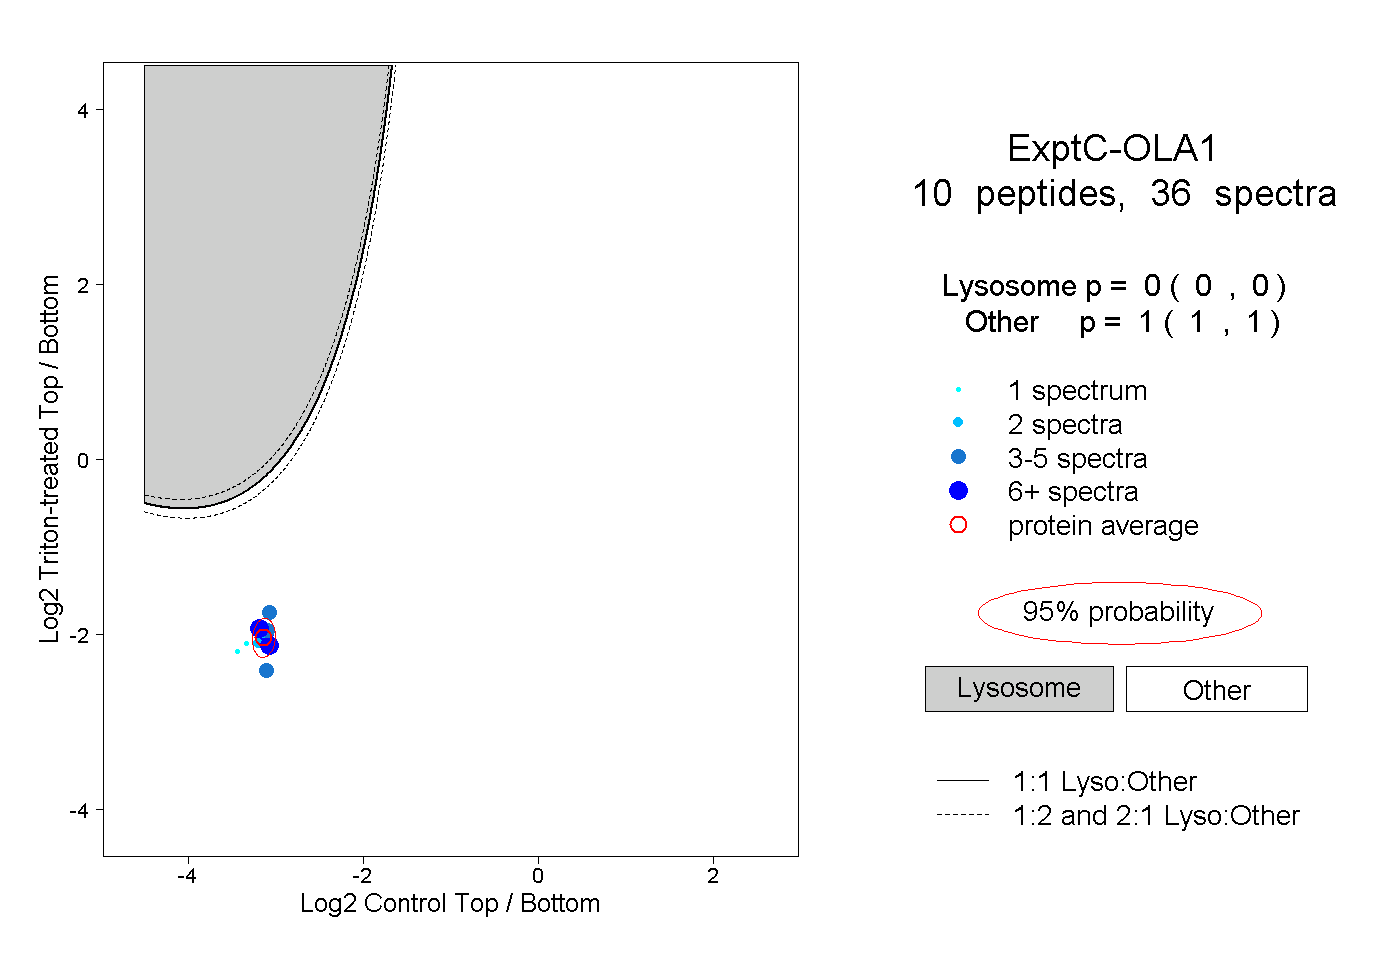
0.000 | 0.000
1.000 | 1.000
1peptide
spectra
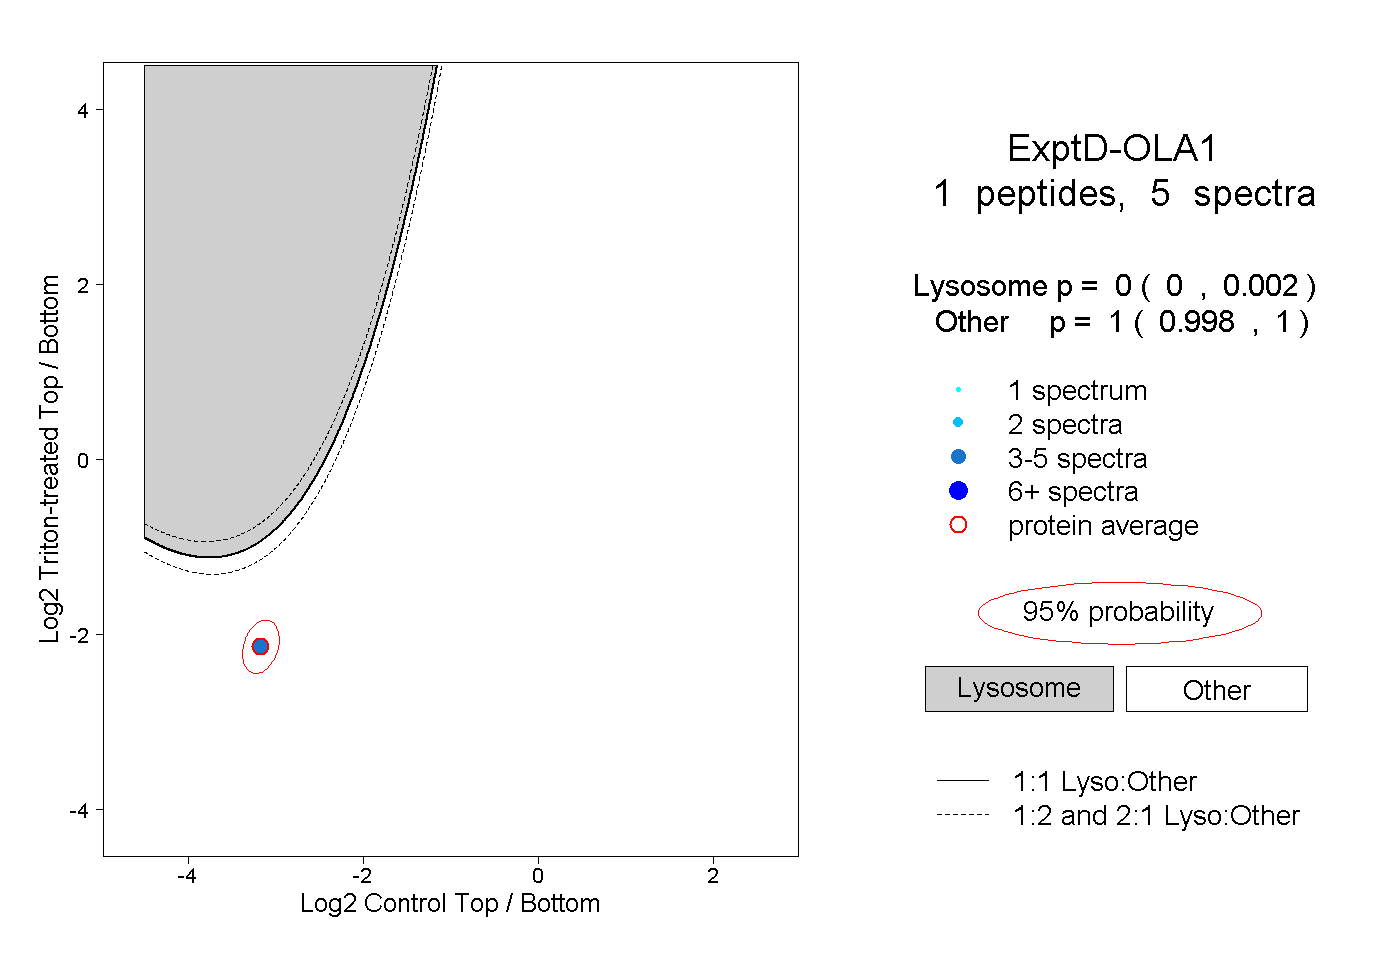
0.000 | 0.002
0.998 | 1.000