 15
15peptides
spectra
0.000 | 0.000
0.000 | 0.000
0.000 | 0.000
0.000 | 0.000
0.000 | 0.000
0.000 | 0.000
0.942 | 0.948
0.051 | 0.057
| Plot | Mito | Lyso | Perox | ER | Golgi | PM | Cytosol | Nucleus | |||||
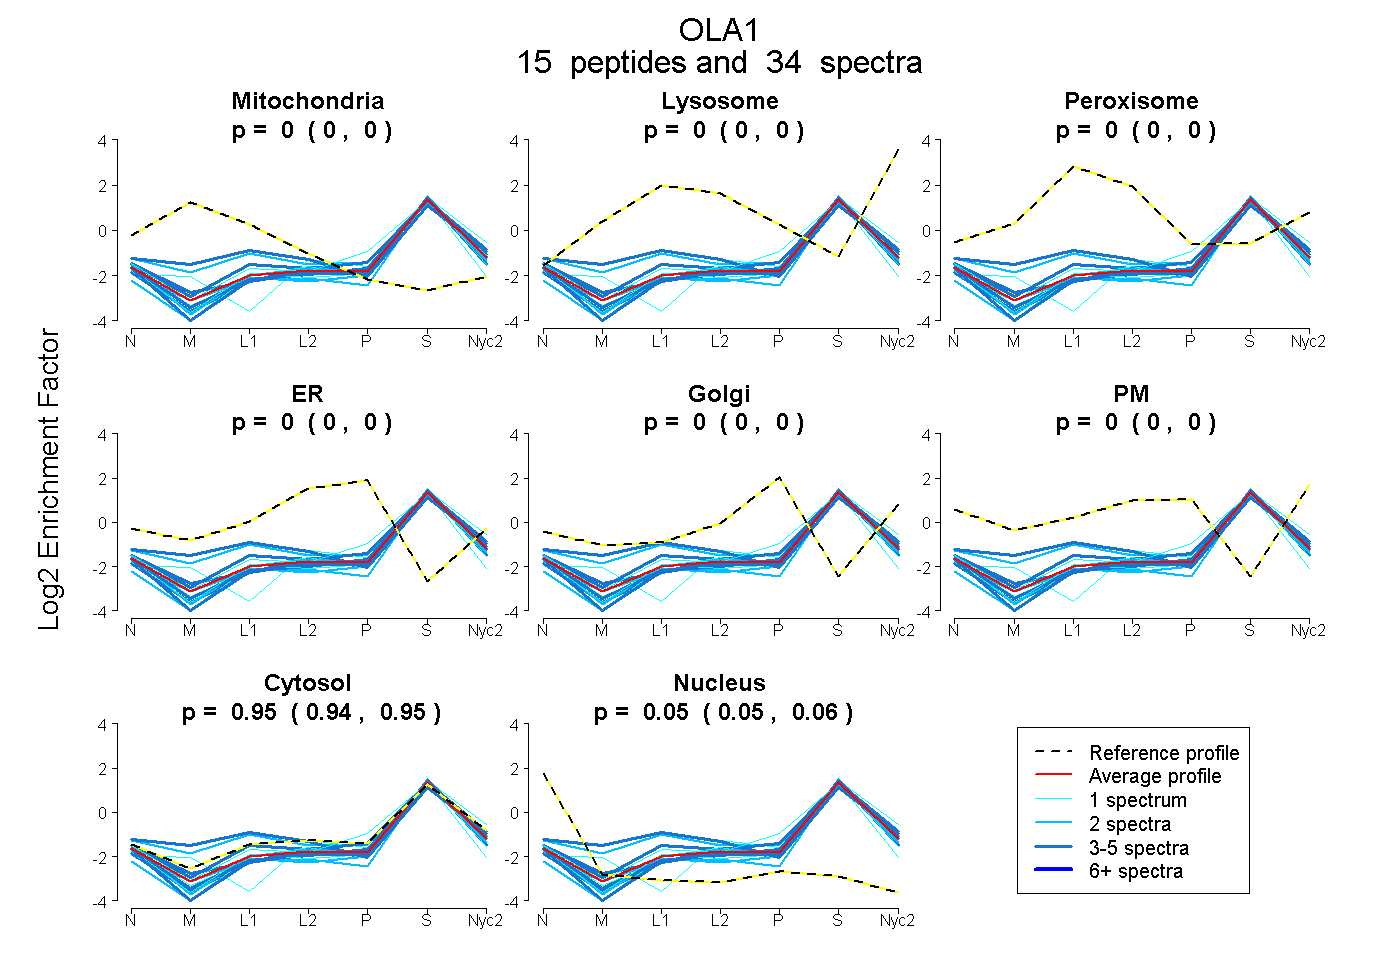
| Expt A |
15 peptides |
34 spectra |
|
0.000 0.000 | 0.000 |
0.000 0.000 | 0.000 |
0.000 0.000 | 0.000 |
0.000 0.000 | 0.000 |
0.000 0.000 | 0.000 |
0.000 0.000 | 0.000 |
0.945 0.942 | 0.948 |
0.055 0.051 | 0.057 |
| 1 spectrum, IHTDFEK | 0.000 | 0.000 | 0.000 | 0.000 | 0.000 | 0.000 | 0.996 | 0.004 | ||
| 4 spectra, SWVIDQK | 0.158 | 0.000 | 0.025 | 0.000 | 0.000 | 0.000 | 0.817 | 0.000 | ||
| 1 spectrum, VPVPDER | 0.000 | 0.000 | 0.000 | 0.000 | 0.000 | 0.000 | 0.969 | 0.031 | ||
| 1 spectrum, AWTIR | 0.000 | 0.000 | 0.000 | 0.000 | 0.000 | 0.000 | 0.943 | 0.057 | ||
| 2 spectra, AFEDDDITHVEGSVDPIR | 0.000 | 0.000 | 0.000 | 0.000 | 0.000 | 0.000 | 0.912 | 0.088 | ||
| 2 spectra, APQAAGK | 0.094 | 0.000 | 0.014 | 0.000 | 0.000 | 0.000 | 0.892 | 0.000 | ||
| 3 spectra, IGIVGLPNVGK | 0.000 | 0.000 | 0.000 | 0.000 | 0.000 | 0.000 | 0.926 | 0.074 | ||
| 4 spectra, LQELSAEER | 0.000 | 0.000 | 0.000 | 0.000 | 0.000 | 0.000 | 0.941 | 0.059 | ||
| 3 spectra, GGDGLKPPPIIGR | 0.000 | 0.000 | 0.000 | 0.000 | 0.000 | 0.000 | 0.989 | 0.011 | ||
| 4 spectra, SDPGALVIPFSGALELK | 0.000 | 0.000 | 0.000 | 0.000 | 0.000 | 0.000 | 0.935 | 0.065 | ||
| 3 spectra, FNTPQQSK | 0.000 | 0.000 | 0.000 | 0.000 | 0.000 | 0.000 | 0.928 | 0.072 | ||
| 1 spectrum, NYIVEDGDIIFFK | 0.000 | 0.000 | 0.000 | 0.000 | 0.000 | 0.000 | 0.912 | 0.088 | ||
| 1 spectrum, FDFLCQCHKPASK | 0.000 | 0.000 | 0.000 | 0.000 | 0.000 | 0.000 | 0.881 | 0.119 | ||
| 2 spectra, IPAFLNVVDIAGLVK | 0.000 | 0.000 | 0.000 | 0.000 | 0.000 | 0.000 | 0.928 | 0.072 | ||
| 2 spectra, GFIMAEVMK | 0.000 | 0.000 | 0.000 | 0.000 | 0.000 | 0.000 | 0.961 | 0.039 |
| Plot | Mito | Lyso or Perox | ER | Golgi | PM | Cytosol | Nucleus | ||||||
| Expt B |
5 peptides |
12 spectra |
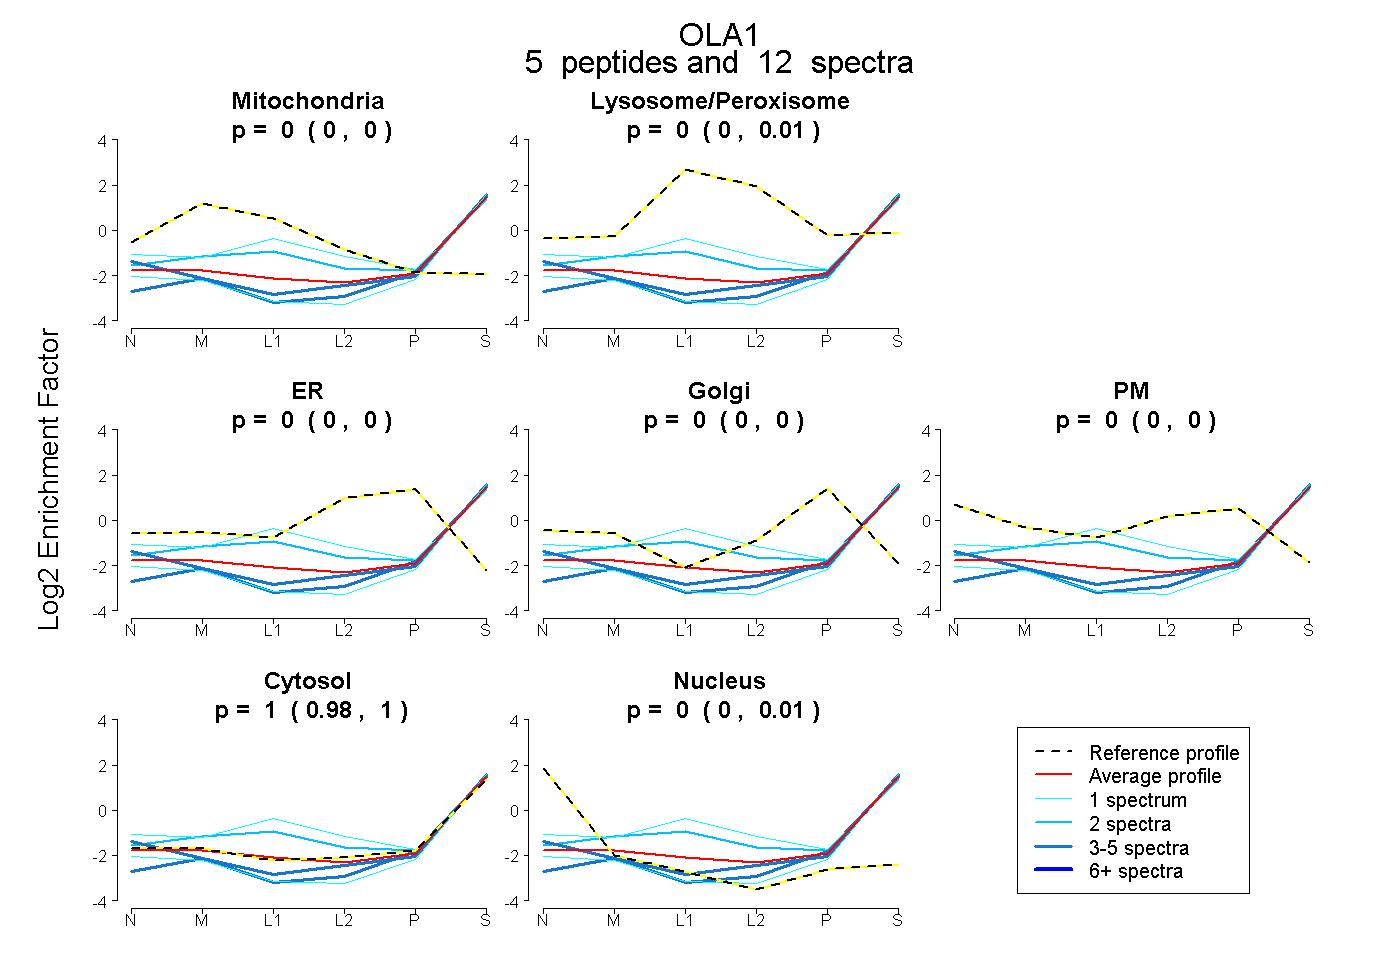 |
0.000 0.000 | 0.000 |
0.000 0.000 | 0.014 |
0.000 0.000 | 0.000 |
0.000 0.000 | 0.000 |
0.000 0.000 | 0.000 |
1.000 0.975 | 1.000 |
0.000 0.000 | 0.011 |
|||
| Plot | Lyso | Other | |||||||||||
| Expt C |
10 peptides |
36 spectra |
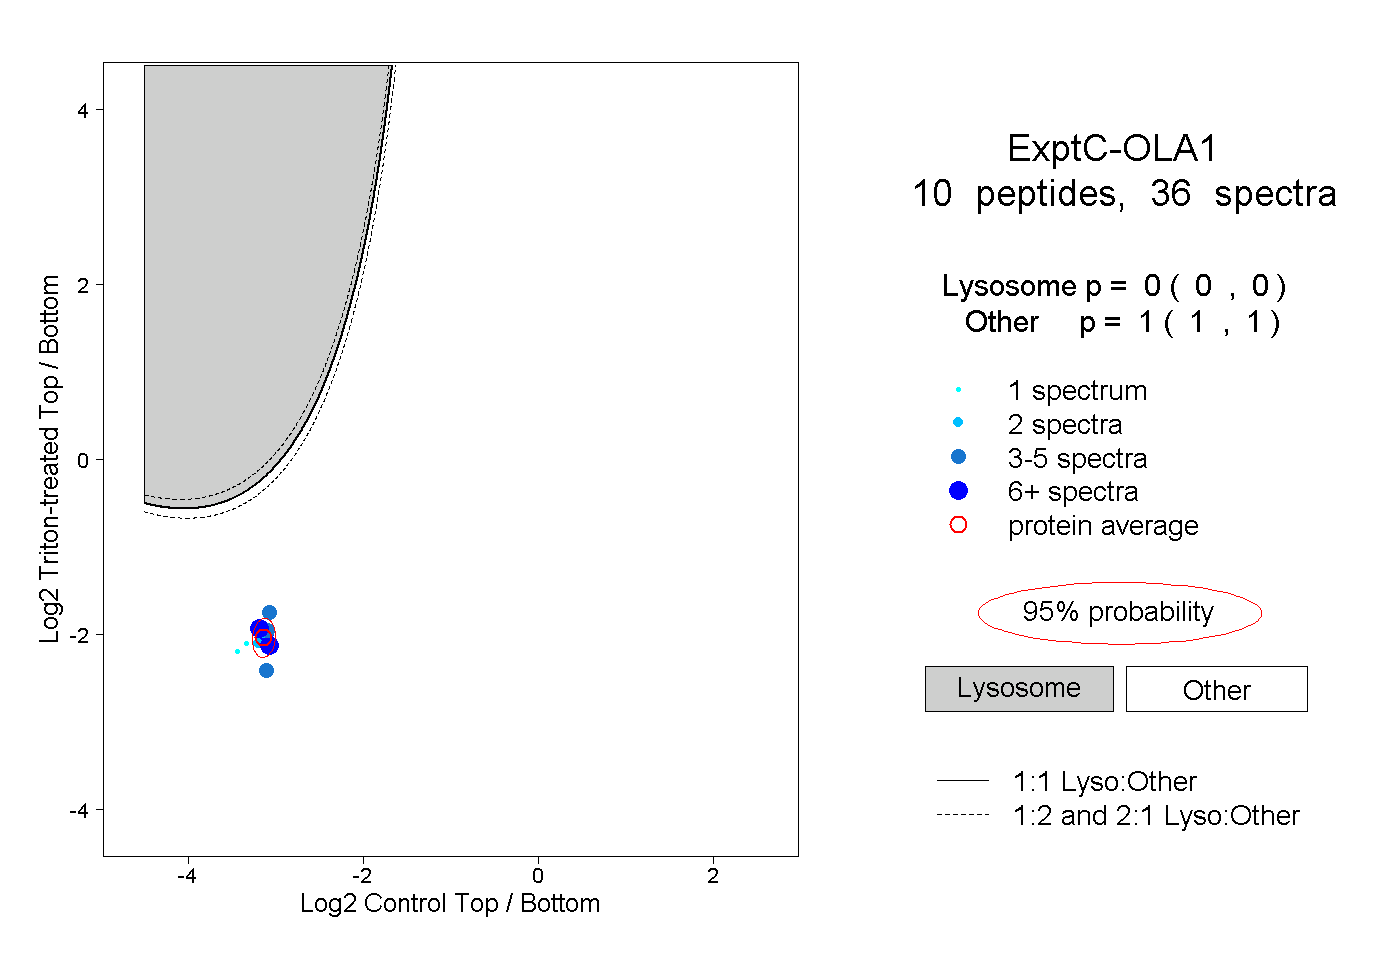 |
0.000 0.000 | 0.000 |
1.000 1.000 | 1.000 |
||||||||
| Plot | Lyso | Other | |||||||||||
| Expt D |
1 peptide |
5 spectra |
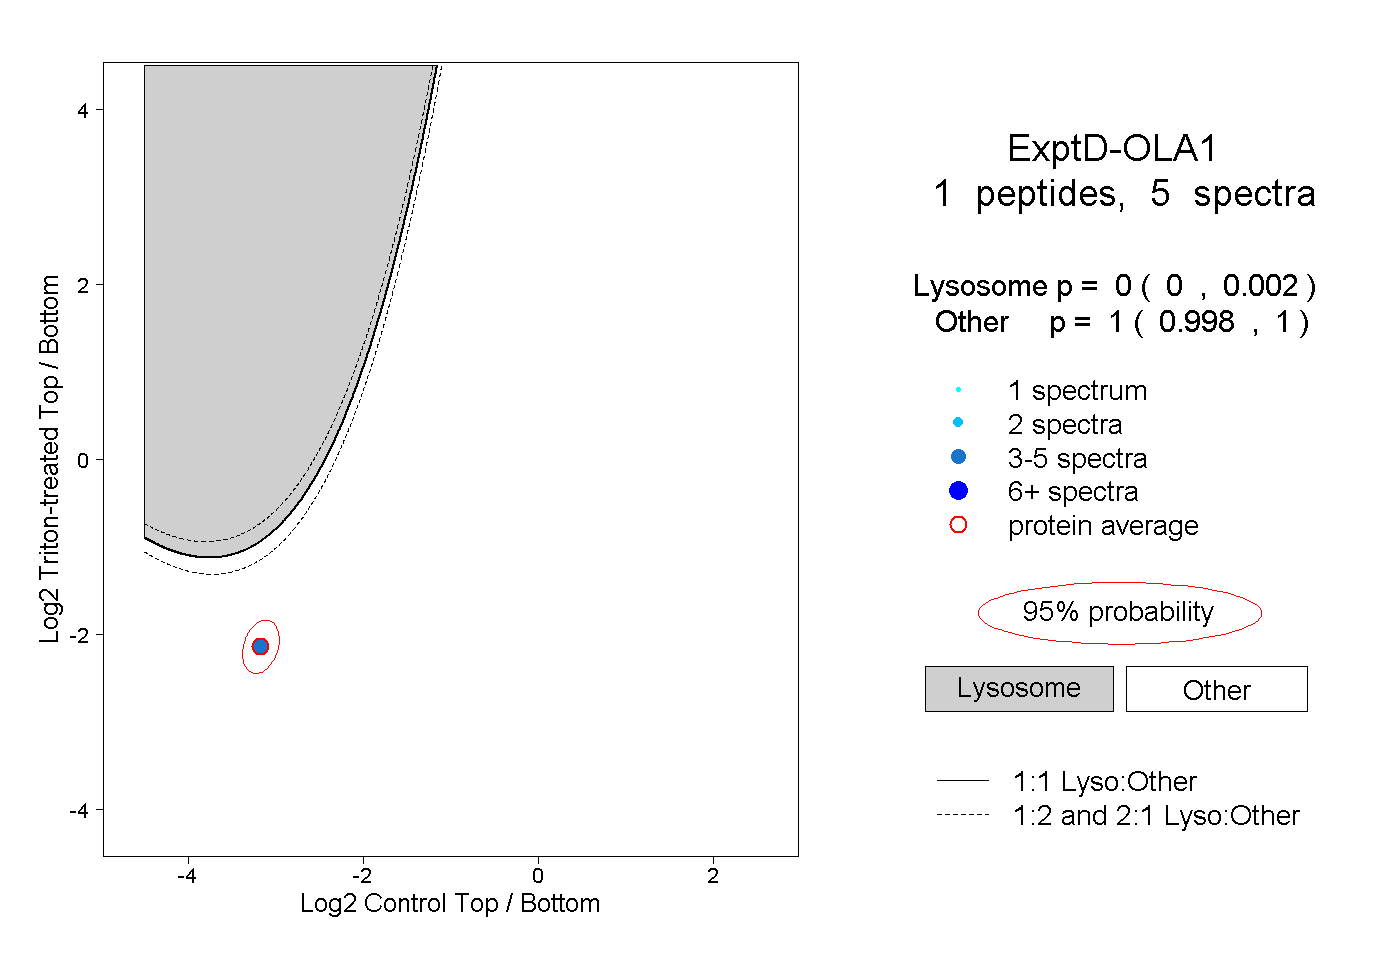 |
0.000 0.000 | 0.002 |
1.000 0.998 | 1.000 |