 5
5peptides
spectra
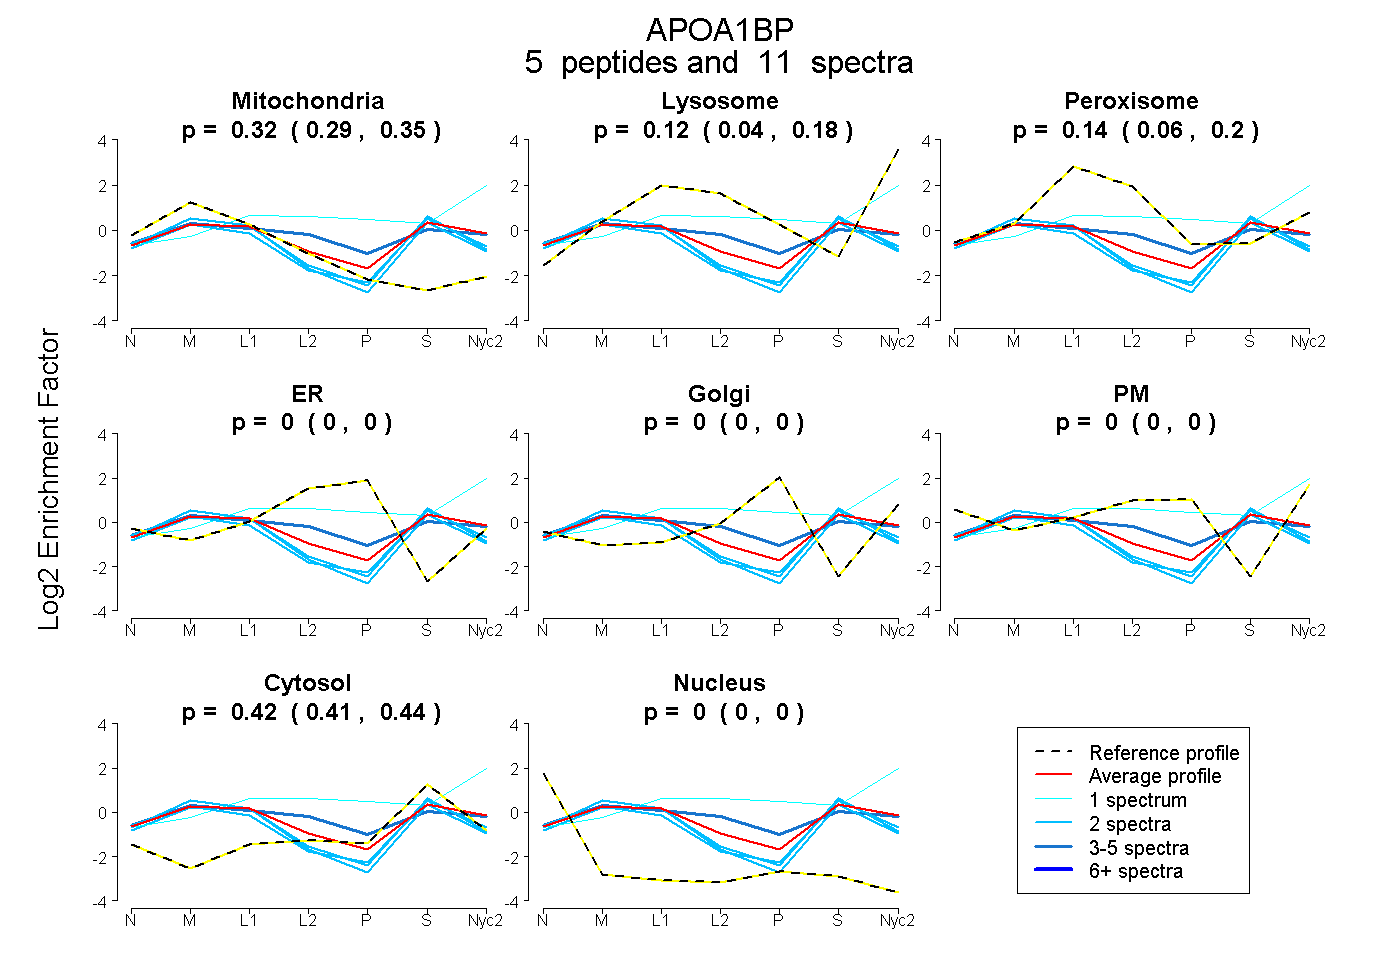
0.287 | 0.346
0.042 | 0.182
0.057 | 0.204
0.000 | 0.000
0.000 | 0.000
0.000 | 0.000
0.407 | 0.436
0.000 | 0.000
4peptides
spectra
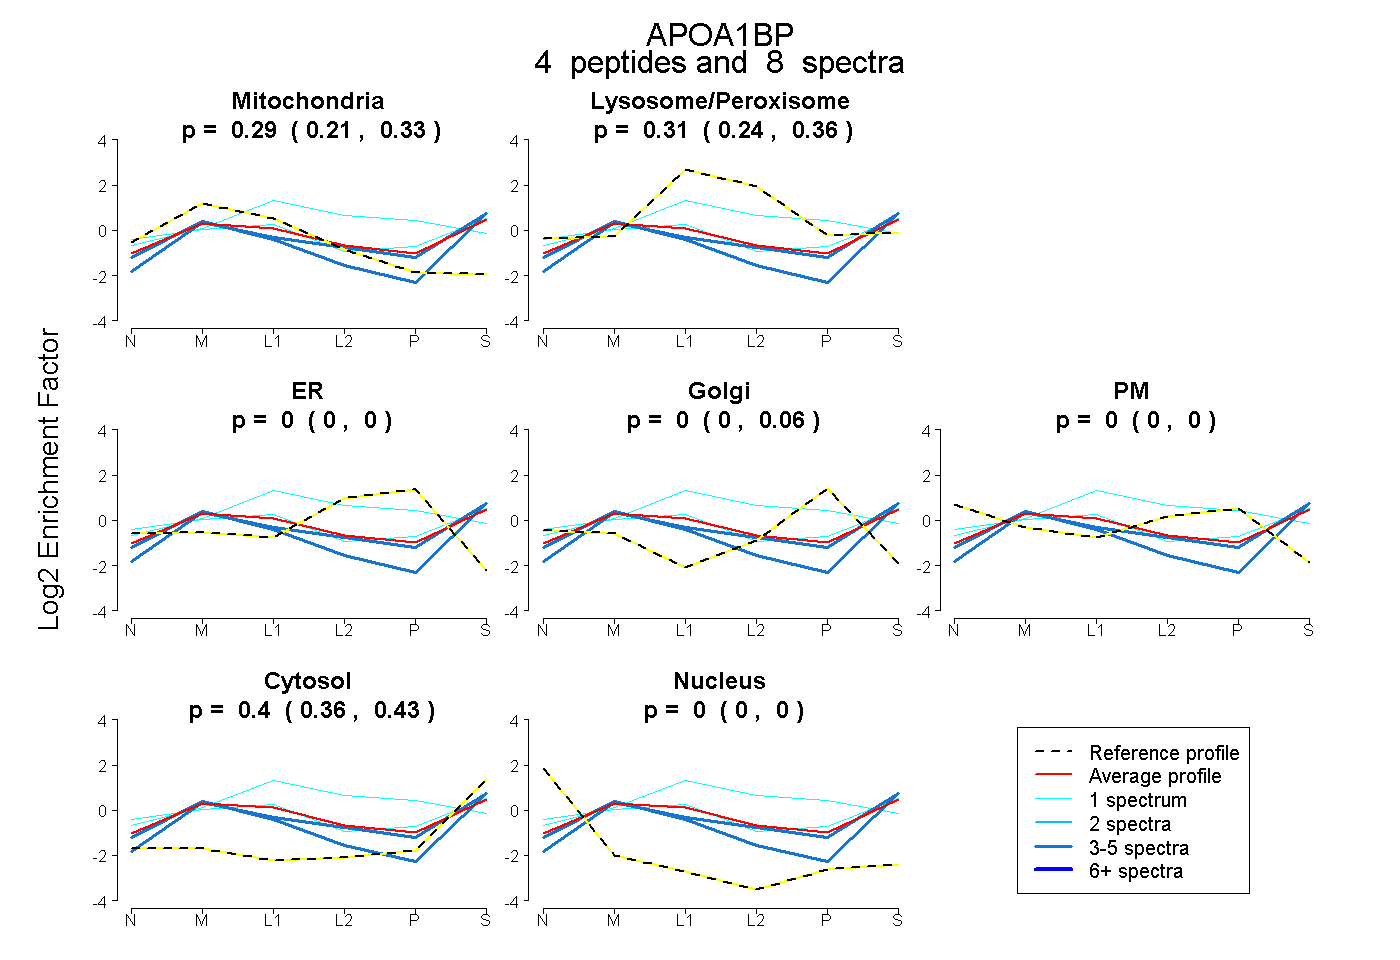
0.214 | 0.334
0.242 | 0.355
0.000 | 0.000
0.000 | 0.056
0.000 | 0.000
0.364 | 0.428
0.000 | 0.000
7peptides
spectra
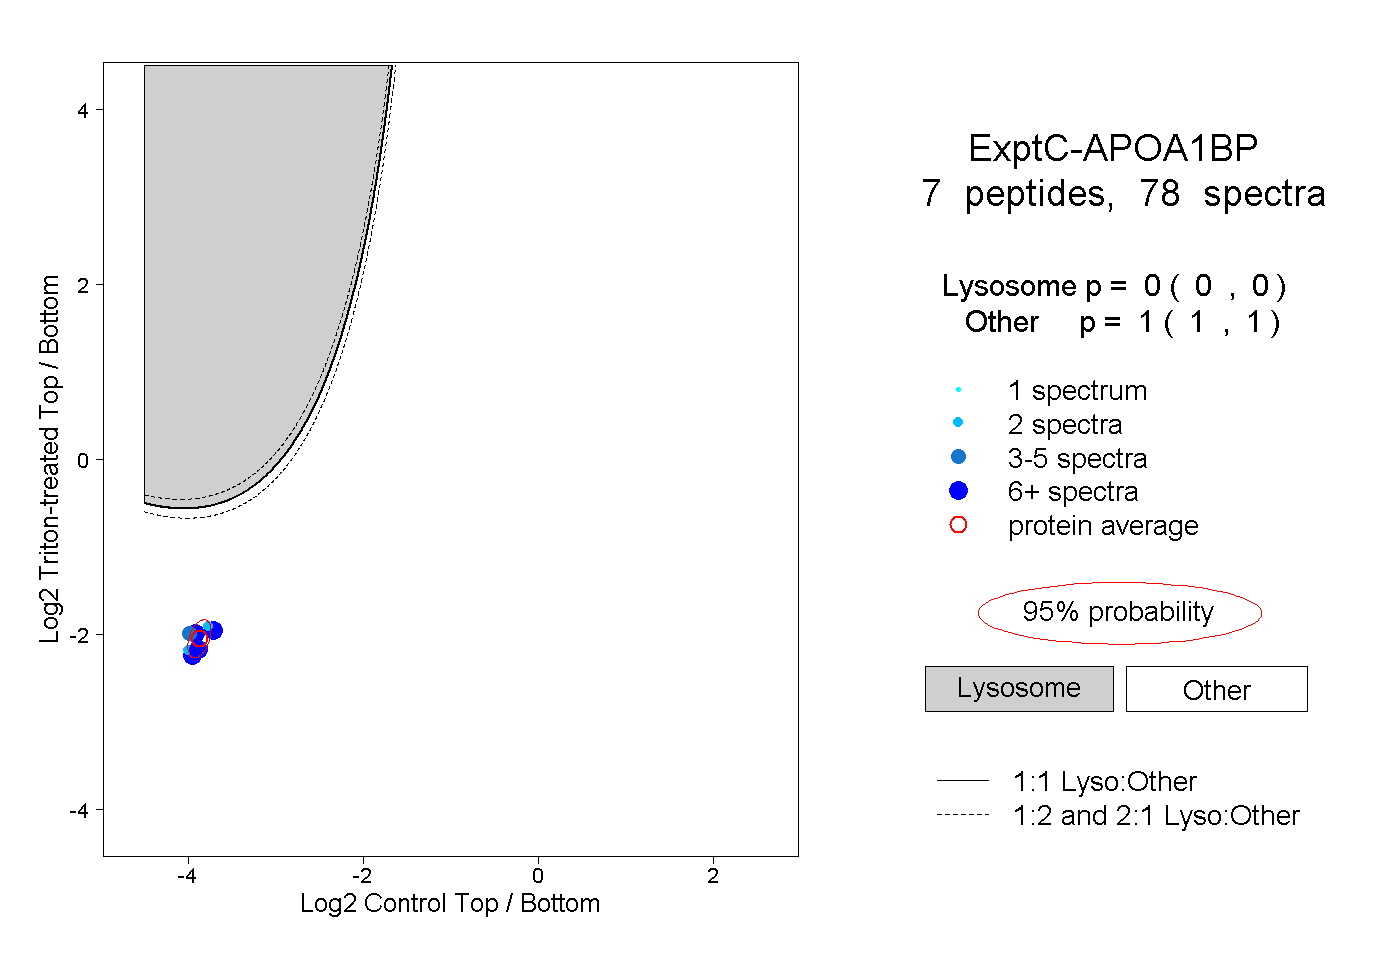
0.000 | 0.000
1.000 | 1.000
2peptides
spectra
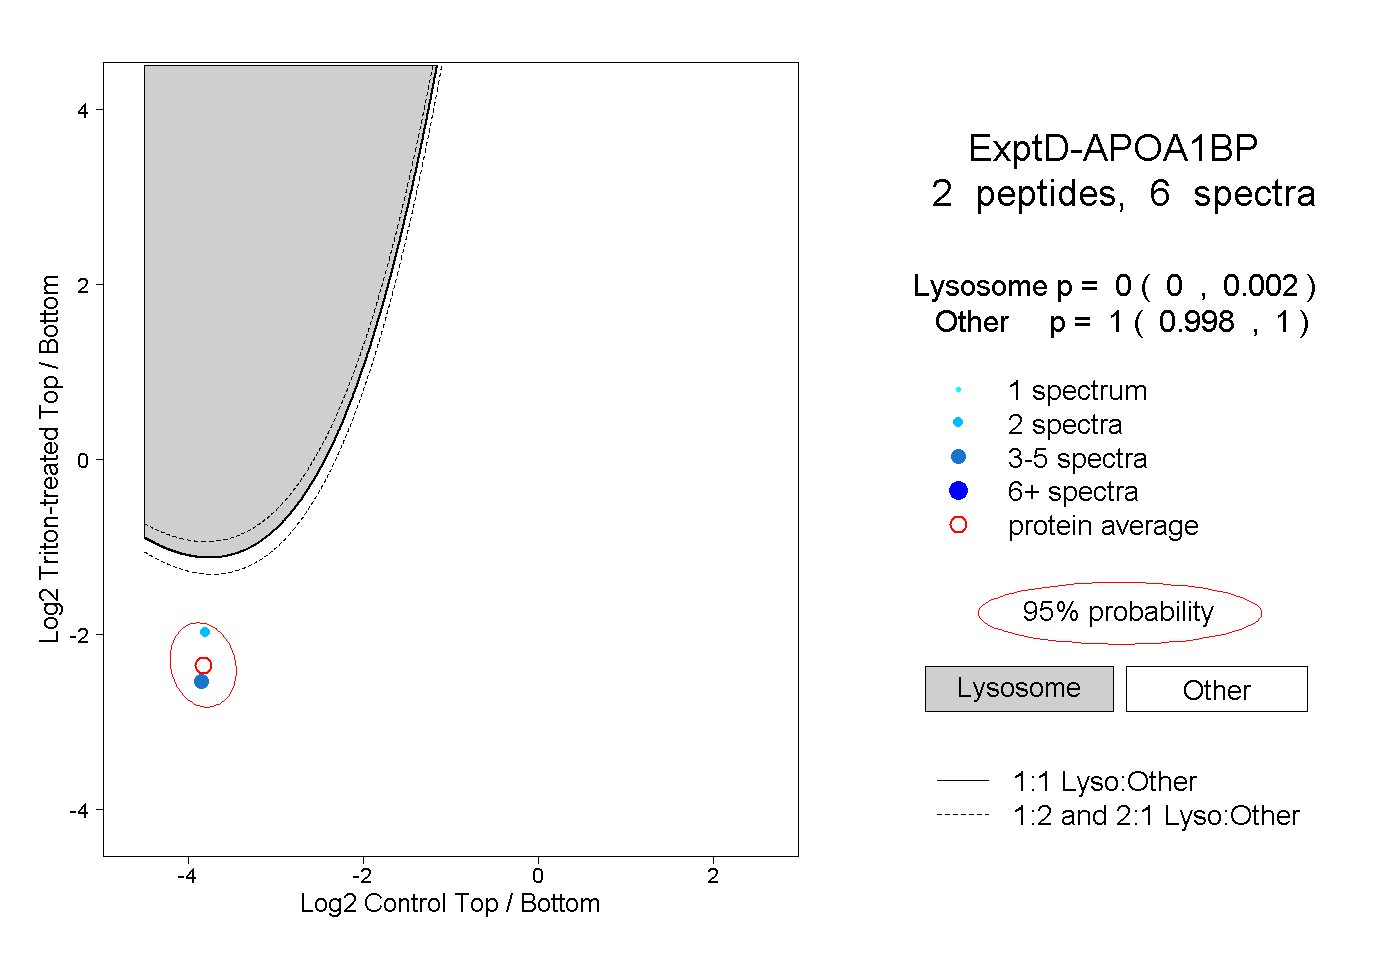
0.000 | 0.002
0.998 | 1.000