 5
5peptides
spectra
0.287 | 0.346
0.042 | 0.182
0.057 | 0.204
0.000 | 0.000
0.000 | 0.000
0.000 | 0.000
0.407 | 0.436
0.000 | 0.000
| Plot | Mito | Lyso | Perox | ER | Golgi | PM | Cytosol | Nucleus | |||||
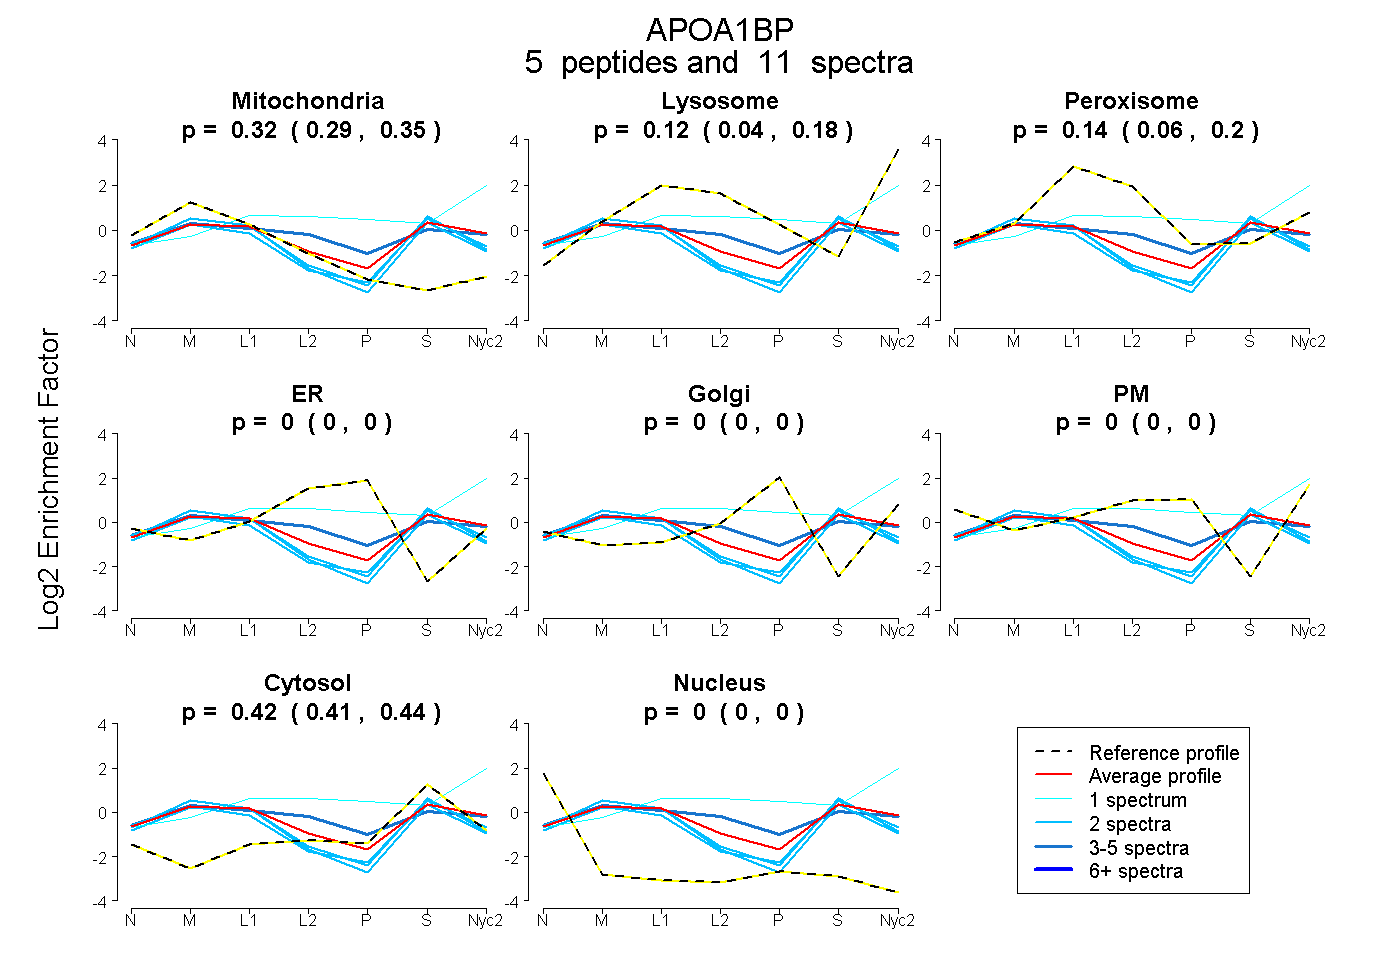
| Expt A |
5 peptides |
11 spectra |
|
0.320 0.287 | 0.346 |
0.117 0.042 | 0.182 |
0.139 0.057 | 0.204 |
0.000 0.000 | 0.000 |
0.000 0.000 | 0.000 |
0.000 0.000 | 0.000 |
0.423 0.407 | 0.436 |
0.000 0.000 | 0.000 |
| 2 spectra, AYPPTSMSK | 0.404 | 0.000 | 0.114 | 0.000 | 0.000 | 0.000 | 0.482 | 0.000 | ||
| 2 spectra, YQLNLPAYPDTECVYR | 0.503 | 0.000 | 0.071 | 0.000 | 0.000 | 0.000 | 0.426 | 0.000 | ||
| 1 spectrum, FVPPALEK | 0.000 | 0.523 | 0.032 | 0.000 | 0.000 | 0.143 | 0.302 | 0.000 | ||
| 2 spectra, YHYLGGR | 0.429 | 0.017 | 0.050 | 0.000 | 0.000 | 0.000 | 0.505 | 0.000 | ||
| 4 spectra, LFGYQPTIYYPK | 0.287 | 0.140 | 0.206 | 0.000 | 0.000 | 0.000 | 0.367 | 0.000 |
| Plot | Mito | Lyso or Perox | ER | Golgi | PM | Cytosol | Nucleus | ||||||
| Expt B |
4 peptides |
8 spectra |
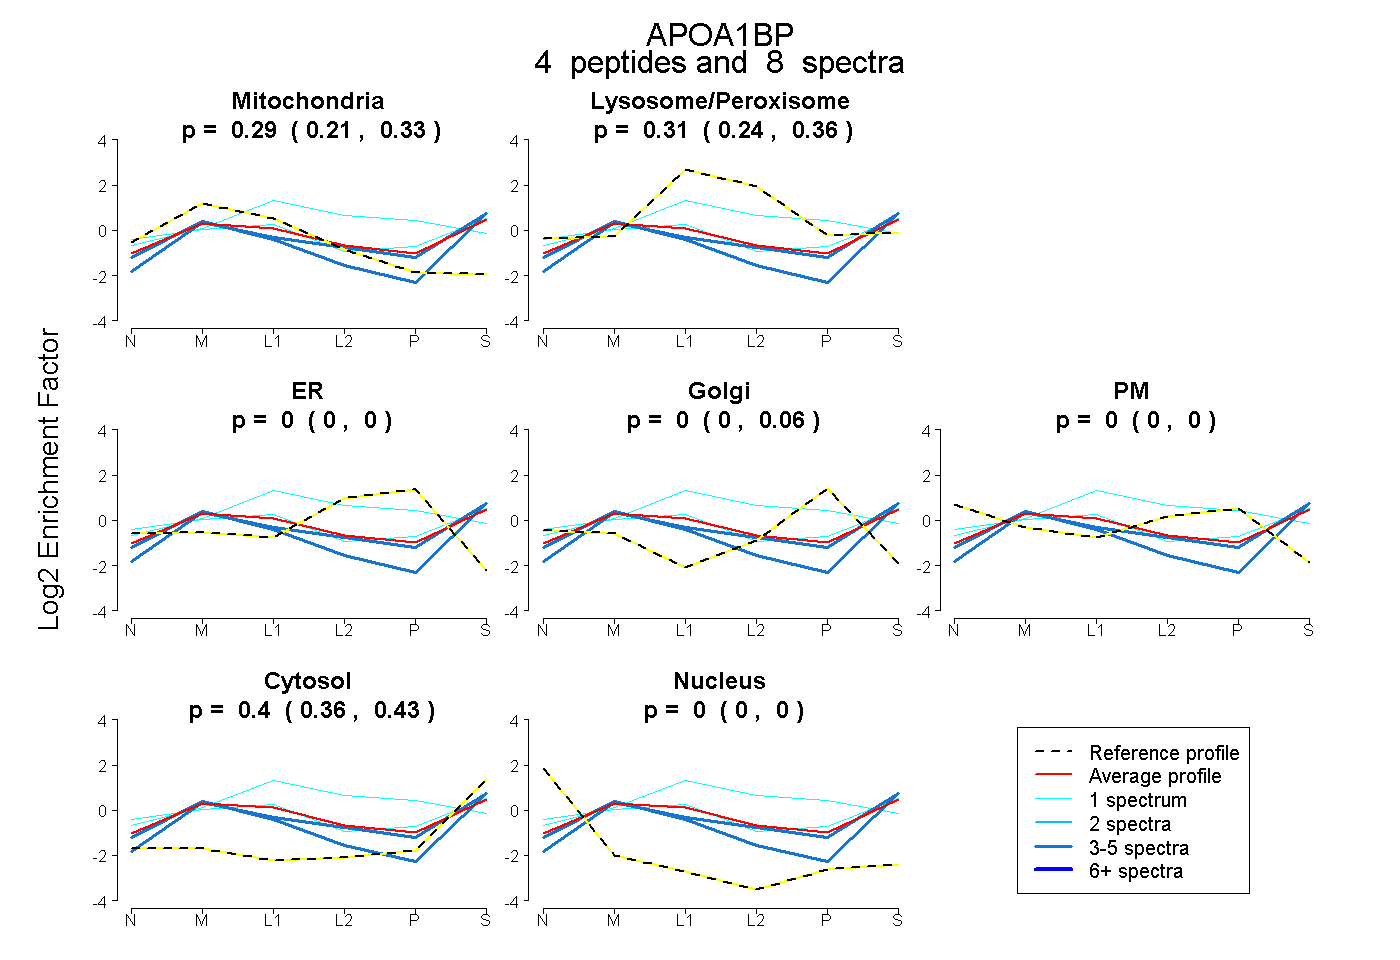 |
0.291 0.214 | 0.334 |
0.305 0.242 | 0.355 |
0.000 0.000 | 0.000 |
0.000 0.000 | 0.056 |
0.000 0.000 | 0.000 |
0.404 0.364 | 0.428 |
0.000 0.000 | 0.000 |
|||
| Plot | Lyso | Other | |||||||||||
| Expt C |
7 peptides |
78 spectra |
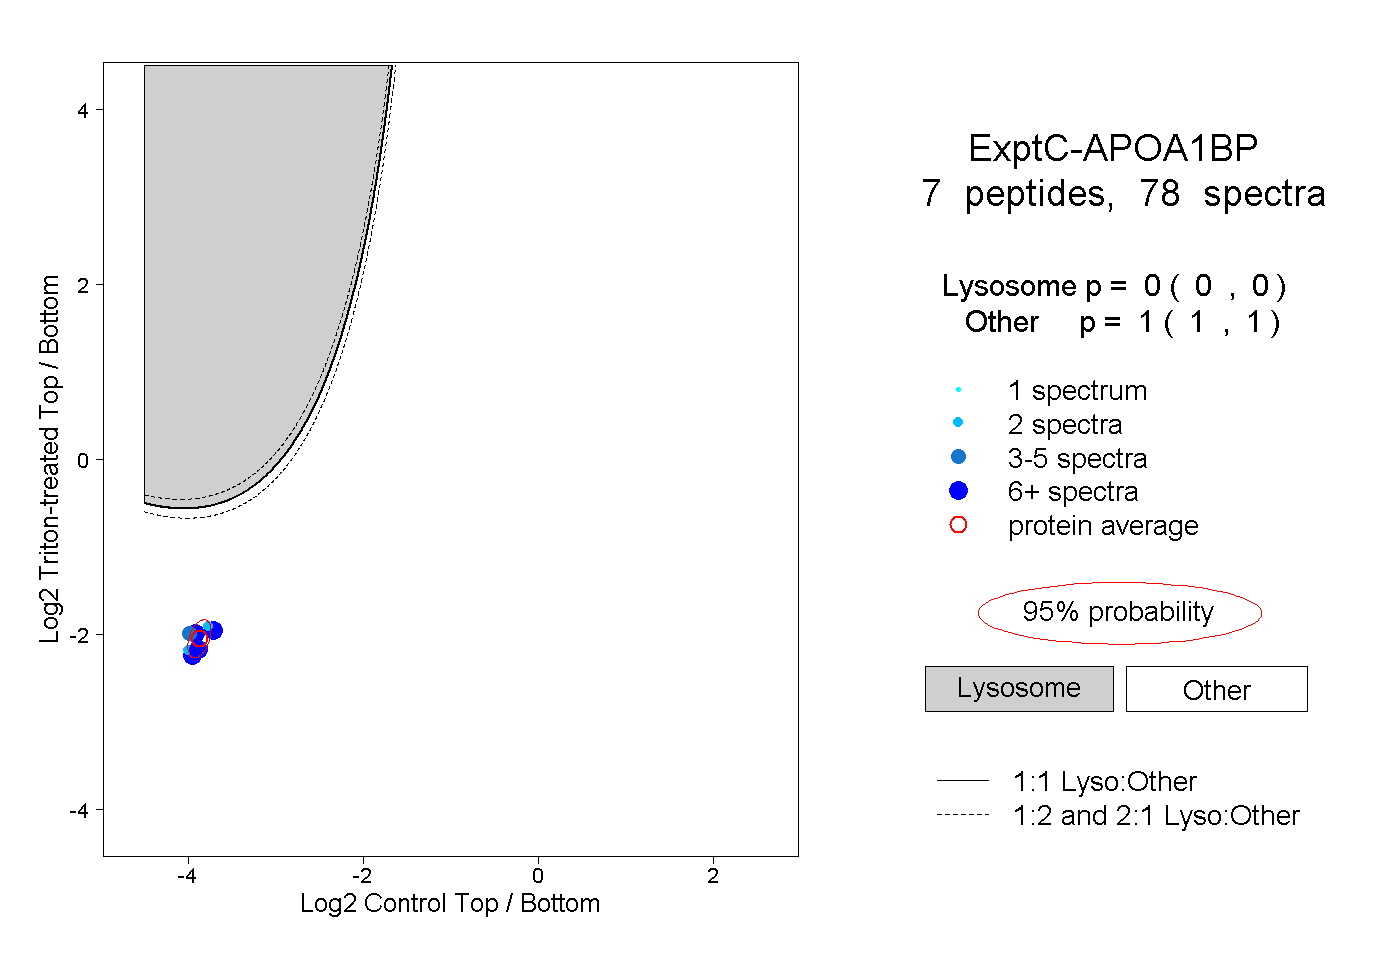 |
0.000 0.000 | 0.000 |
1.000 1.000 | 1.000 |
||||||||
| Plot | Lyso | Other | |||||||||||
| Expt D |
2 peptides |
6 spectra |
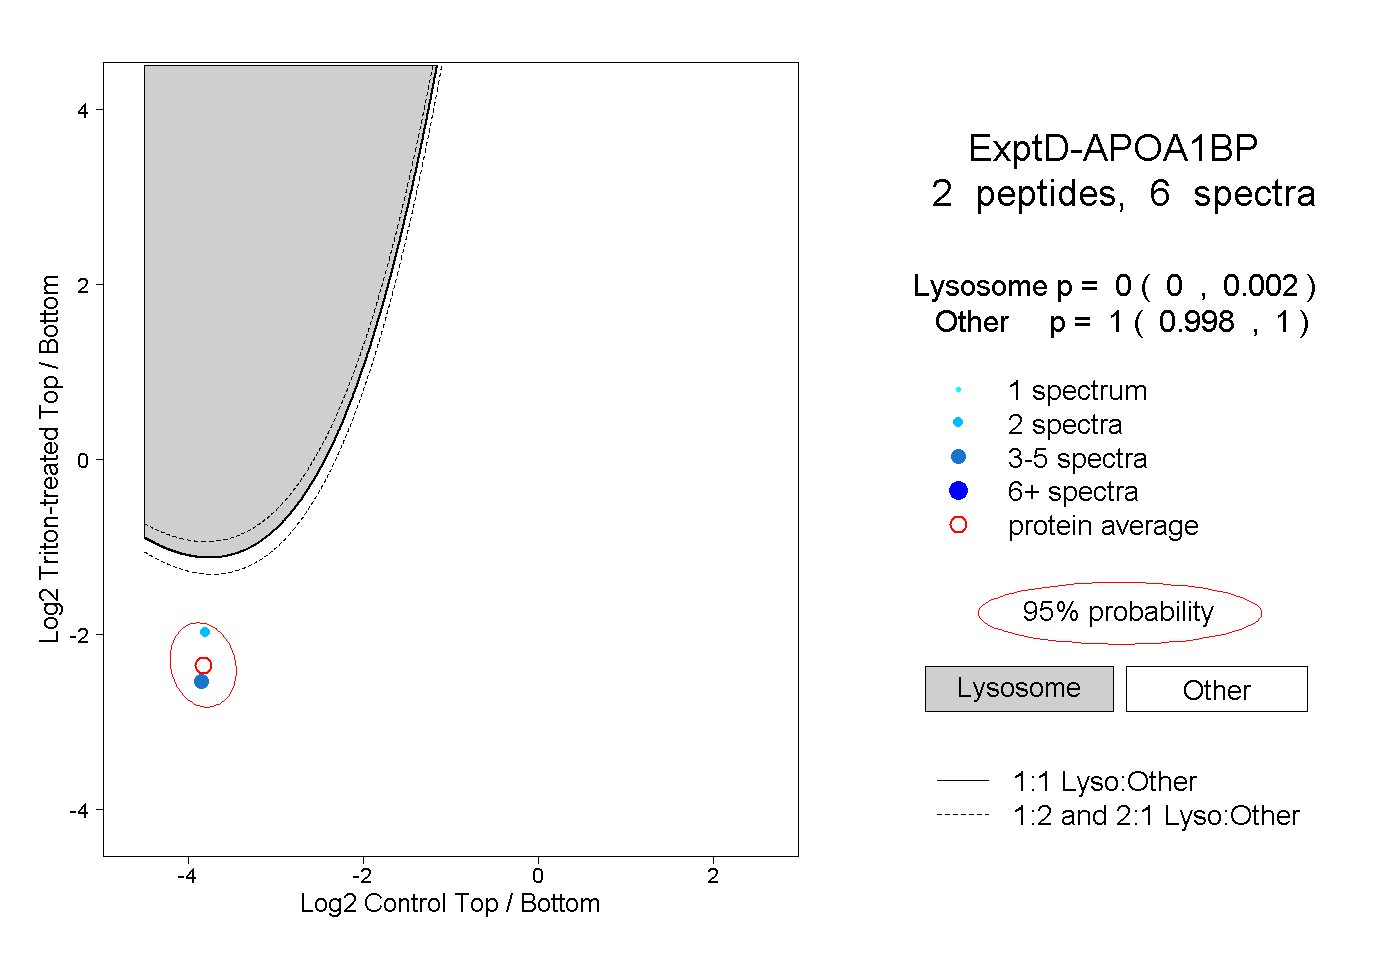 |
0.000 0.000 | 0.002 |
1.000 0.998 | 1.000 |