 35
35peptides
spectra
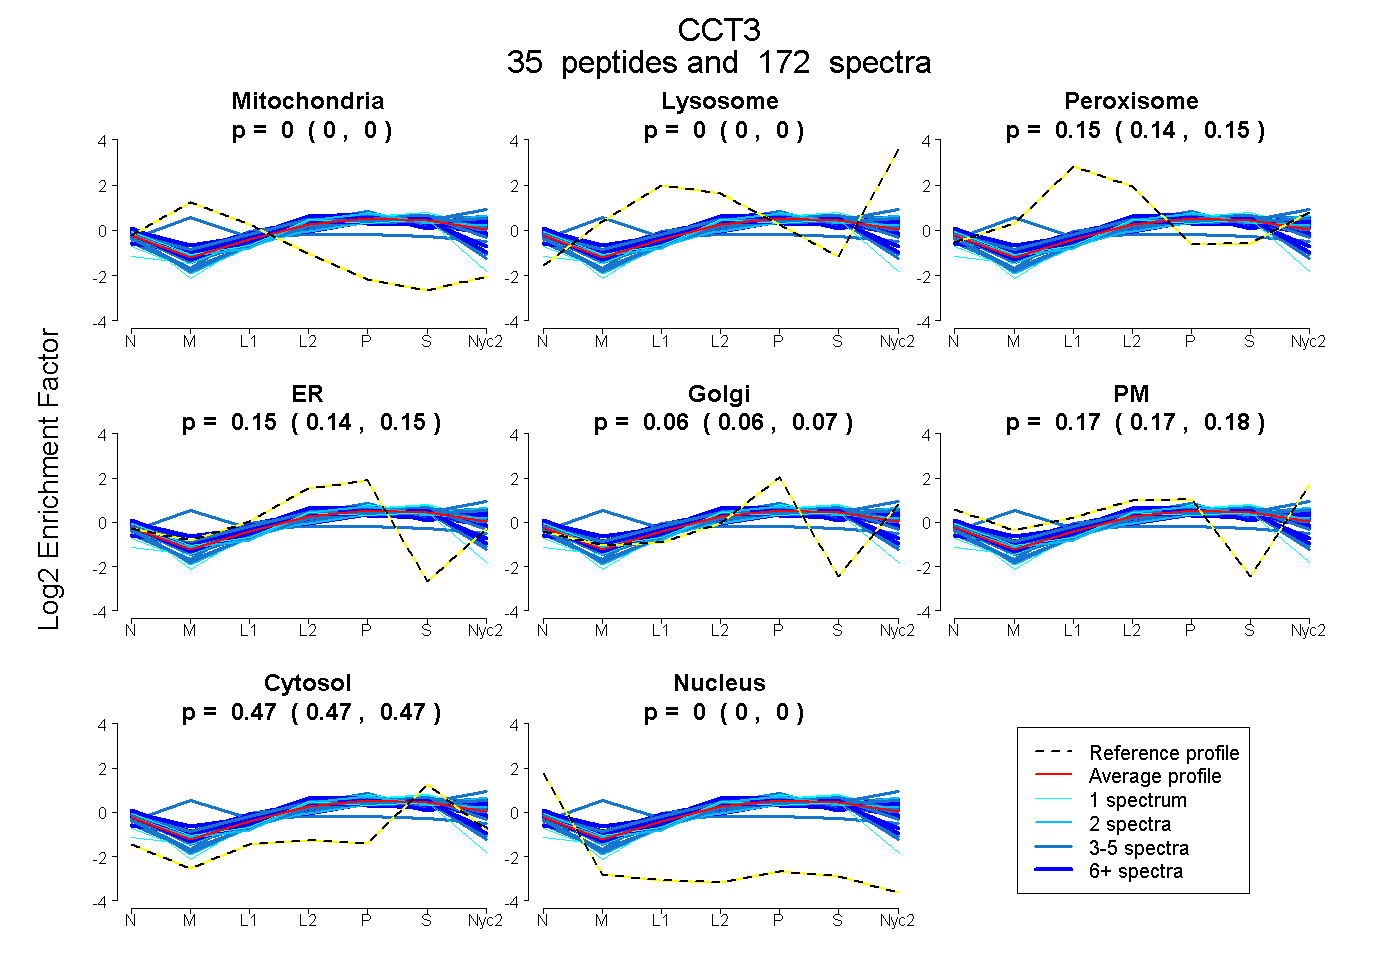
0.000 | 0.000
0.000 | 0.000
0.144 | 0.148
0.139 | 0.151
0.057 | 0.069
0.167 | 0.176
0.471 | 0.474
0.000 | 0.000
23peptides
spectra
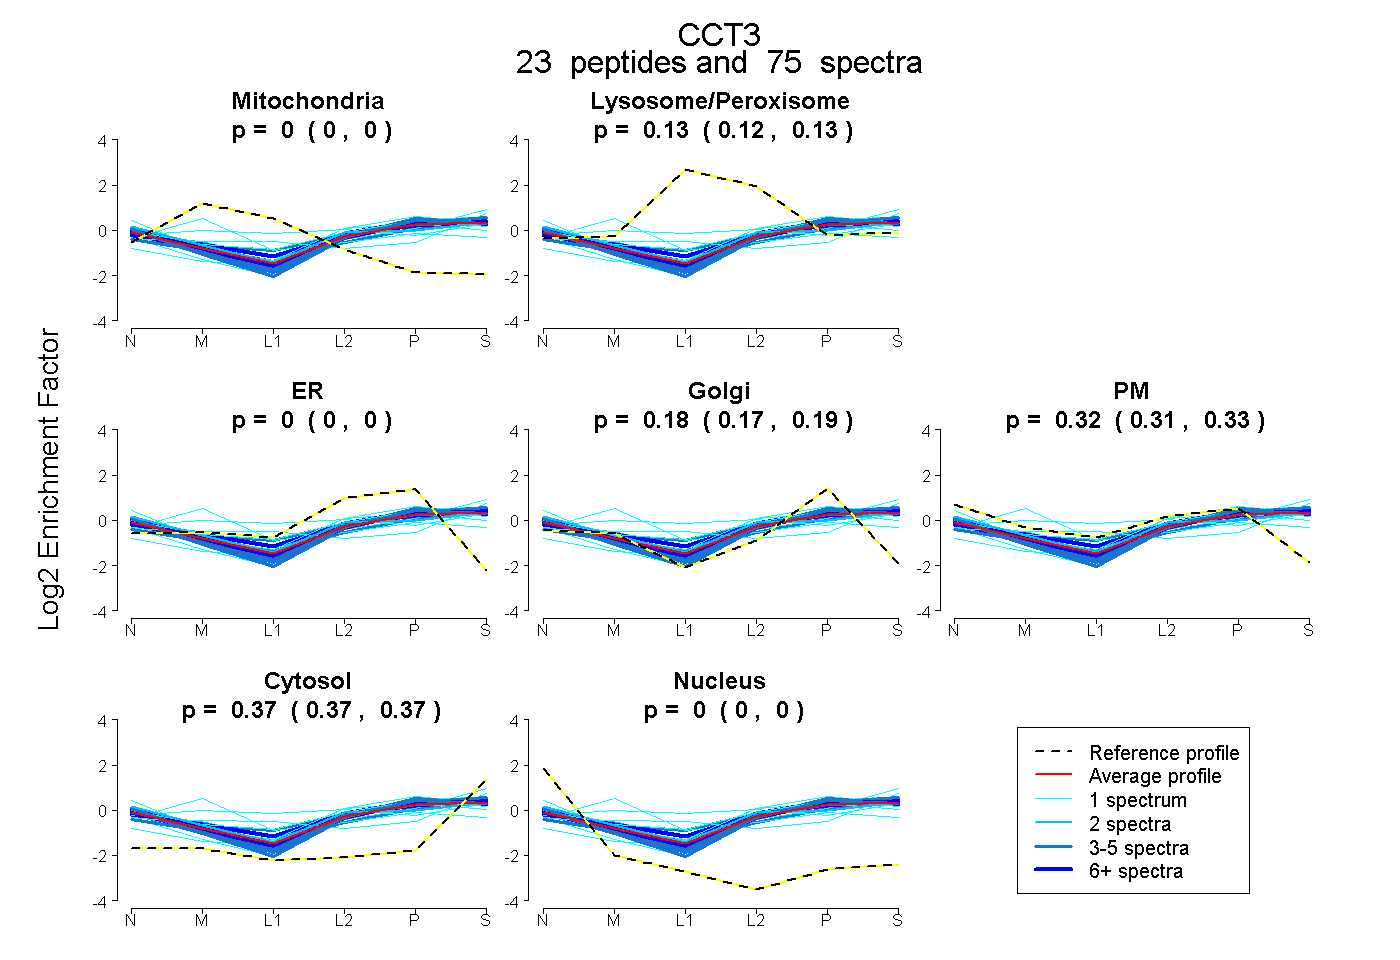
0.000 | 0.000
0.124 | 0.132
0.000 | 0.000
0.173 | 0.185
0.314 | 0.329
0.367 | 0.371
0.000 | 0.000
28peptides
spectra
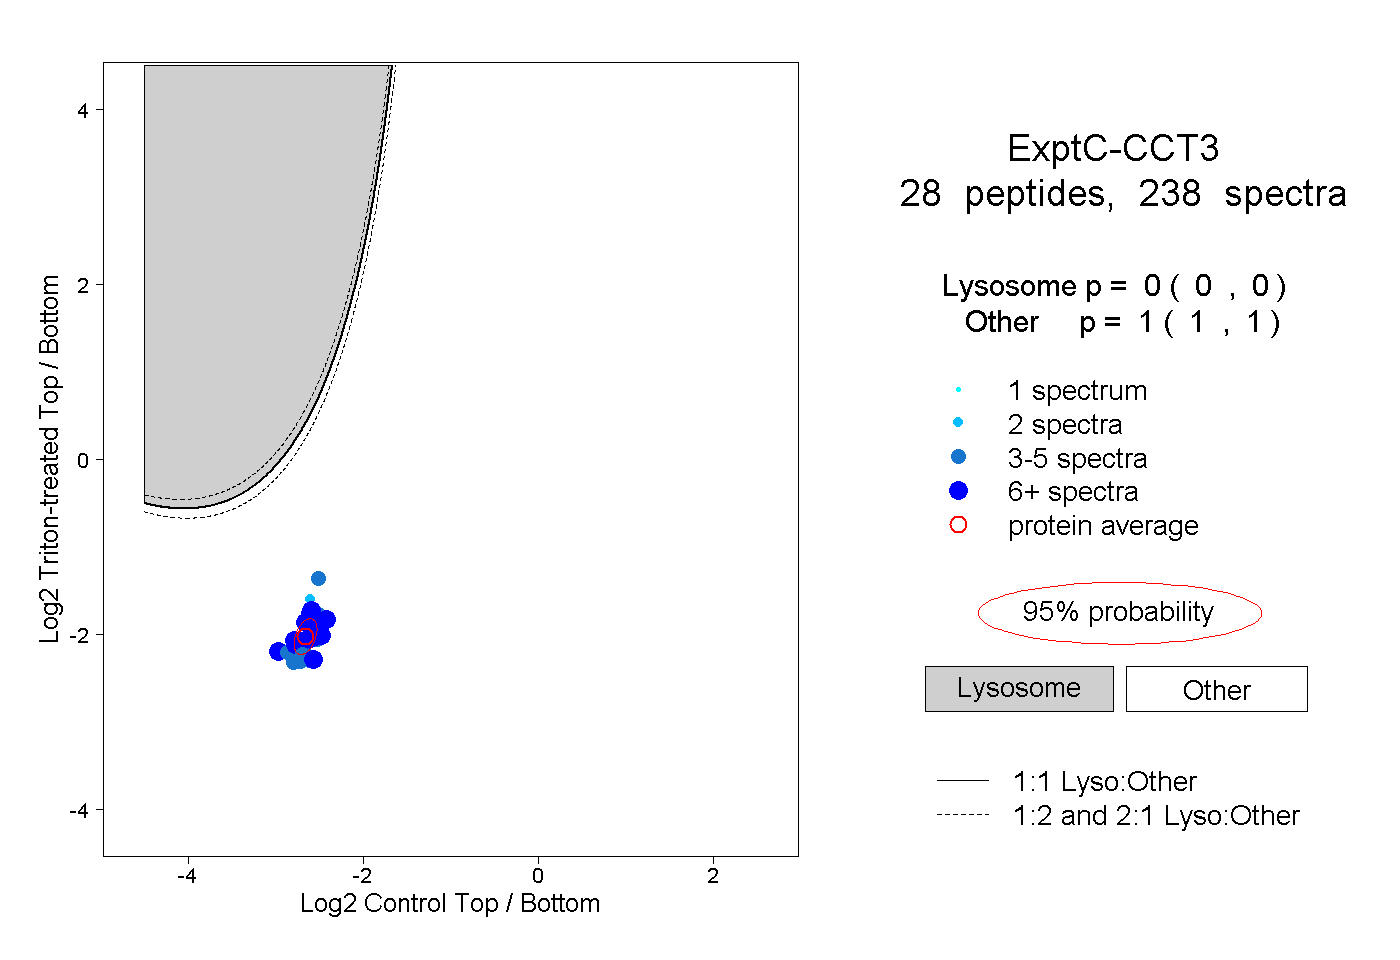
0.000 | 0.000
1.000 | 1.000
10peptides
spectra
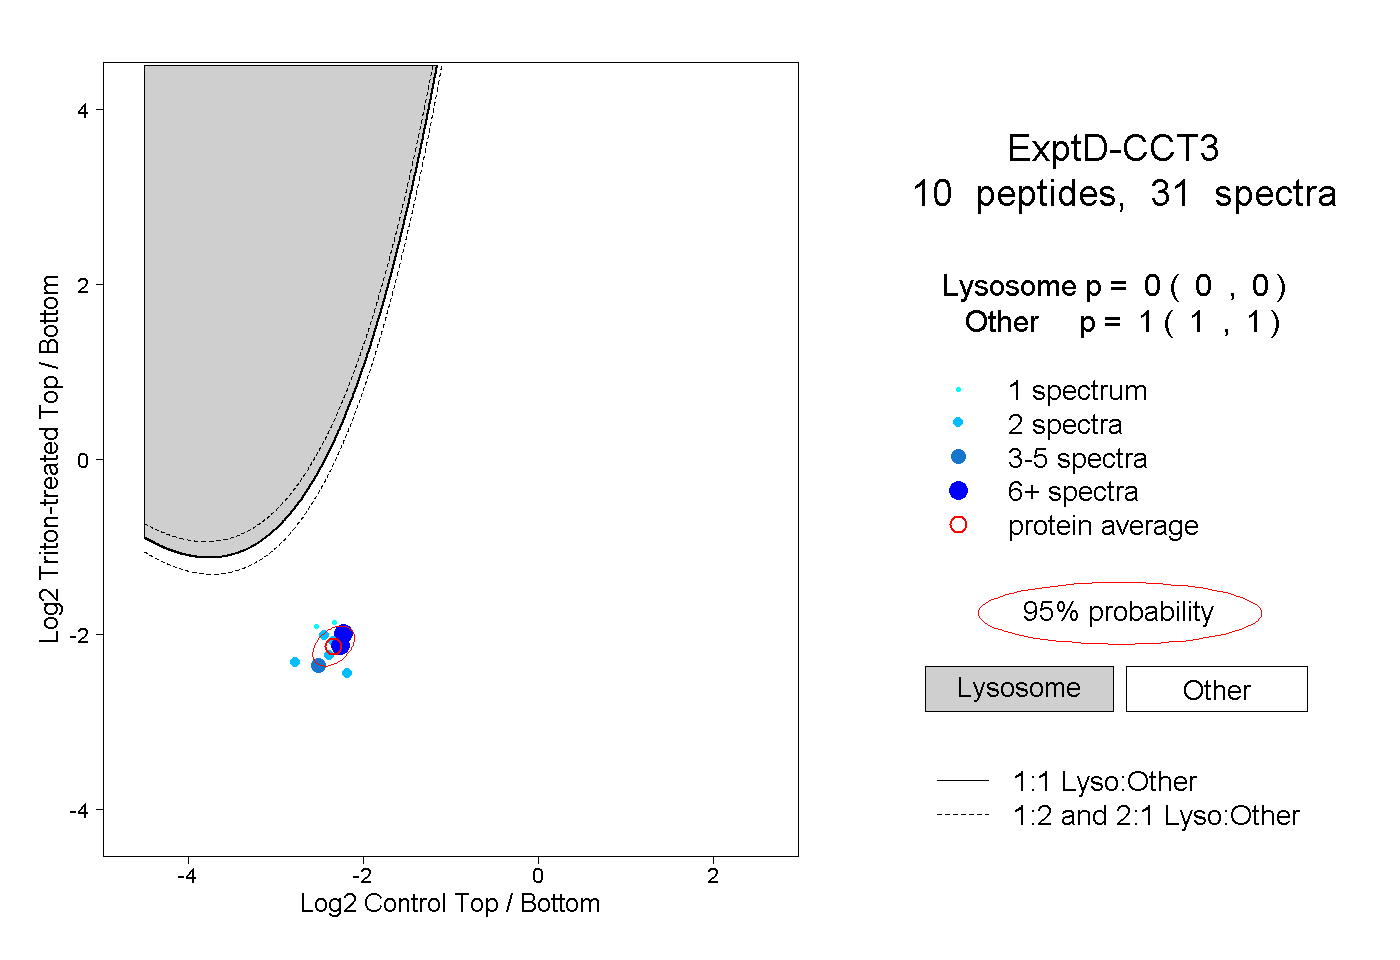
0.000 | 0.000
1.000 | 1.000