 8
8peptides
spectra
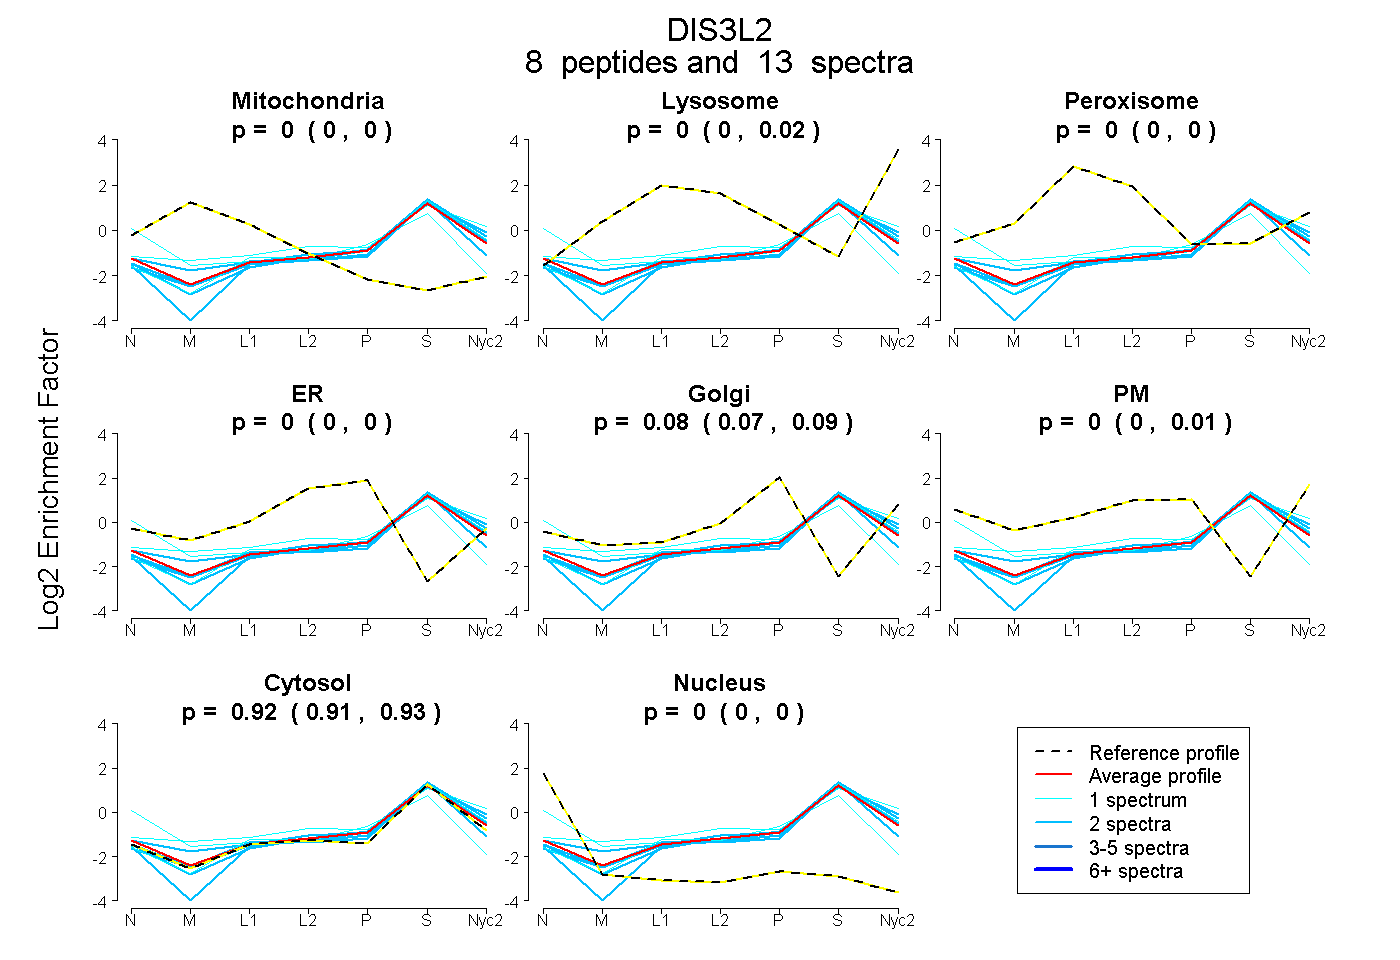
0.000 | 0.000
0.000 | 0.018
0.000 | 0.000
0.000 | 0.000
0.066 | 0.086
0.000 | 0.005
0.905 | 0.926
0.000 | 0.000
4peptides
spectra
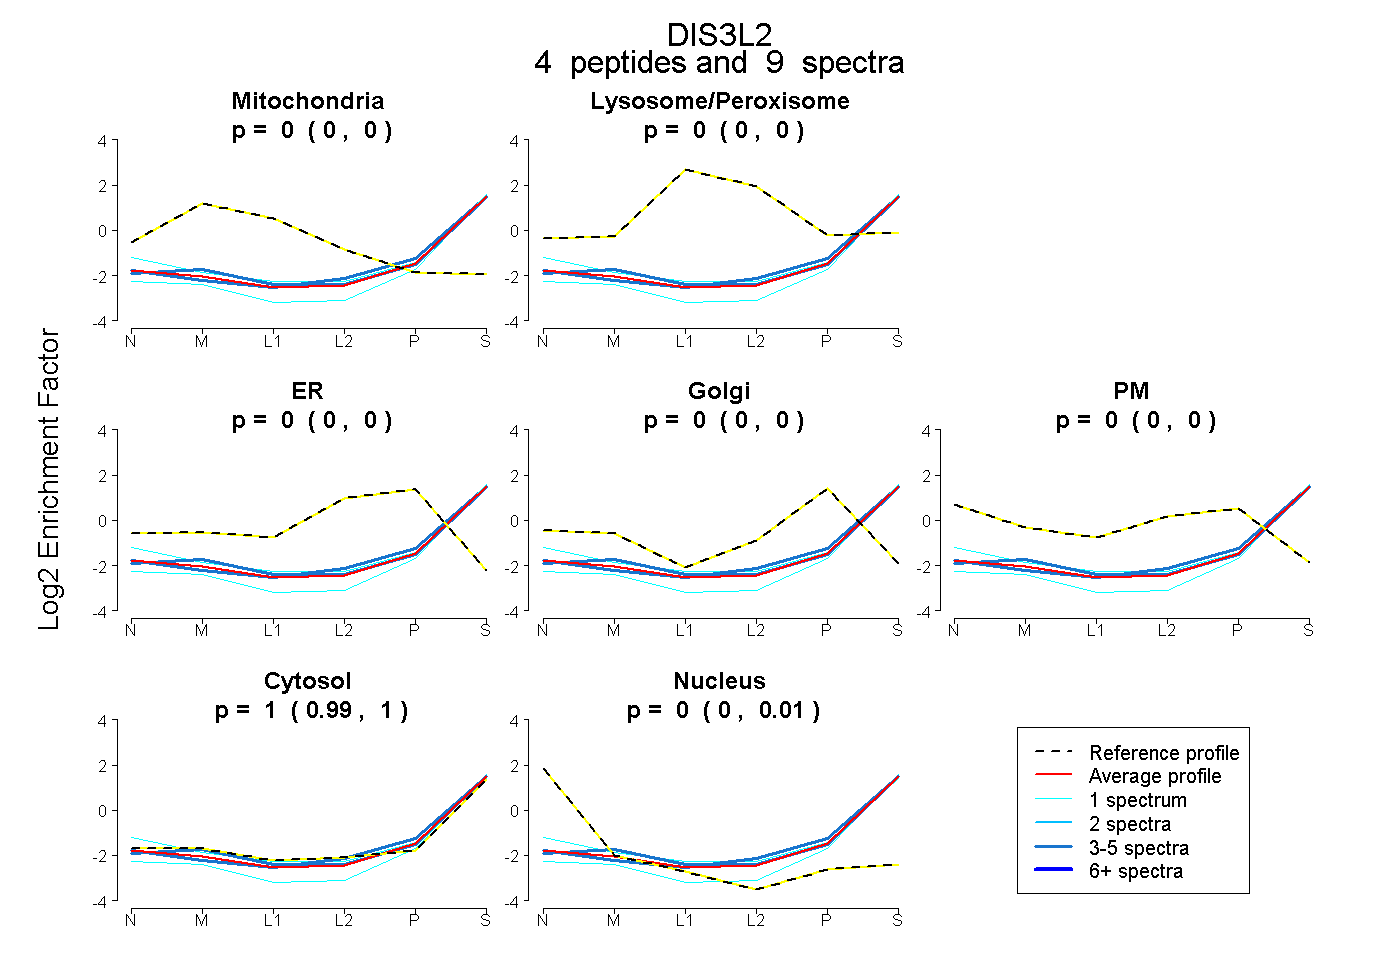
0.000 | 0.000
0.000 | 0.000
0.000 | 0.000
0.000 | 0.000
0.000 | 0.000
0.990 | 1.000
0.000 | 0.007
7peptides
spectra
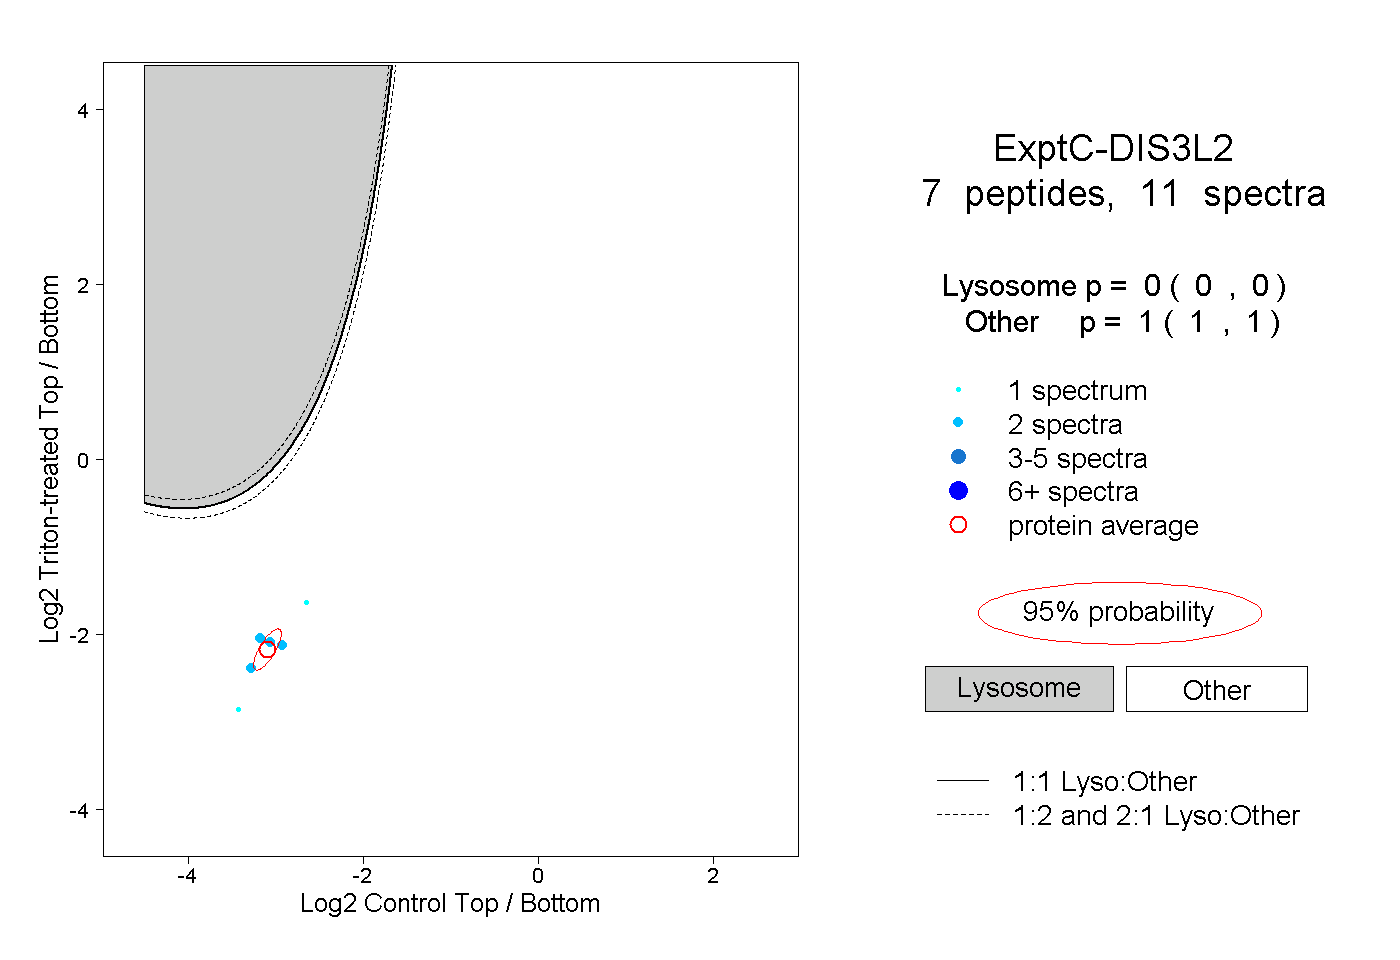
0.000 | 0.000
1.000 | 1.000