 8
8peptides
spectra
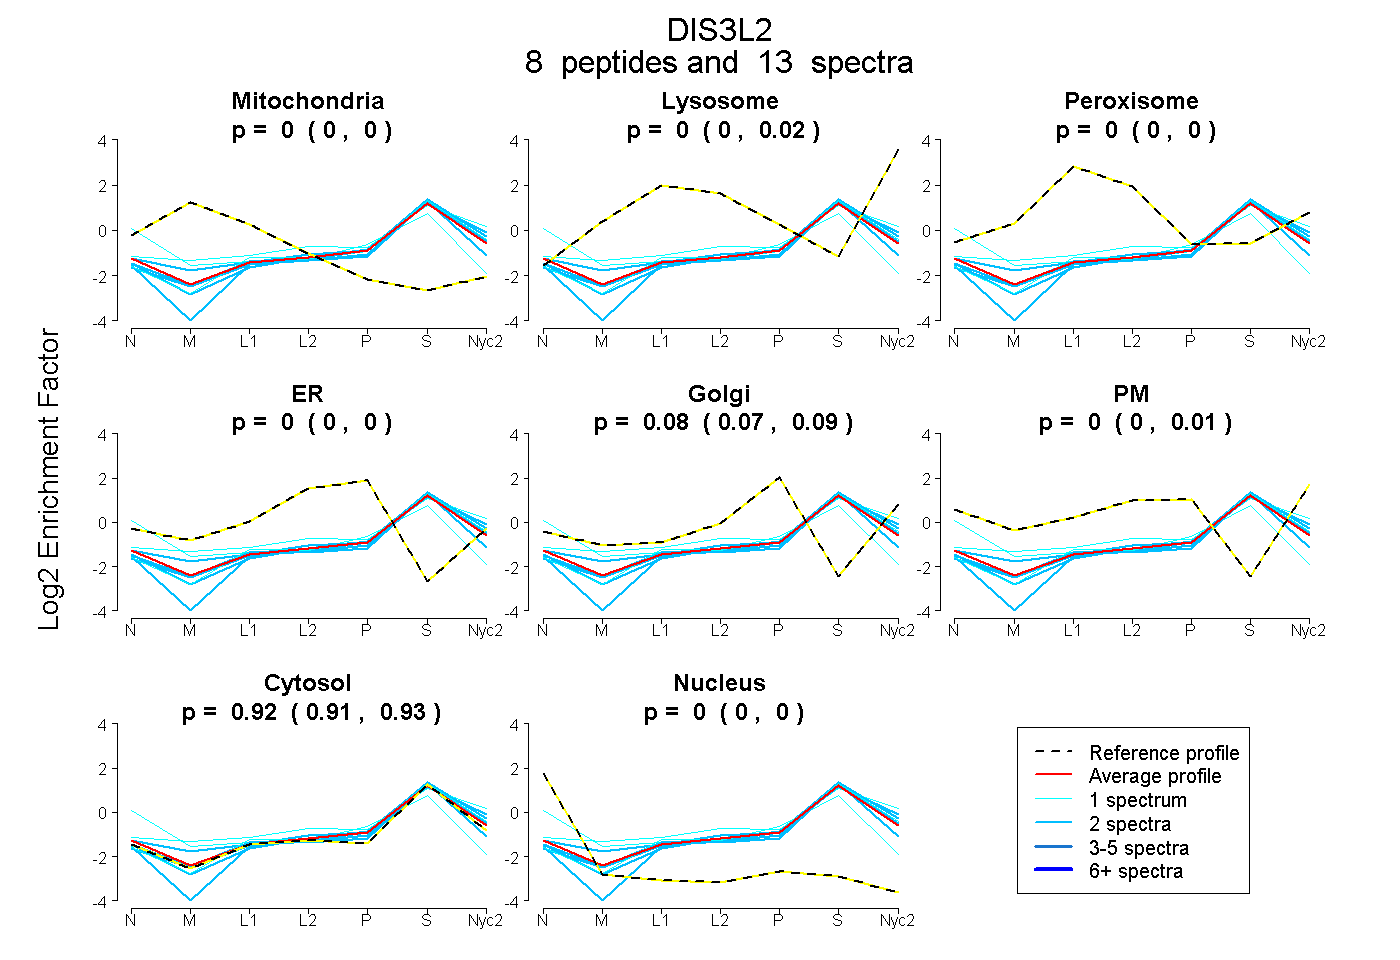
0.000 | 0.000
0.000 | 0.018
0.000 | 0.000
0.000 | 0.000
0.066 | 0.086
0.000 | 0.005
0.905 | 0.926
0.000 | 0.000
| Plot | Mito | Lyso | Perox | ER | Golgi | PM | Cytosol | Nucleus | |||||
| Expt A |
8 peptides |
13 spectra |
|
0.000 0.000 | 0.000 |
0.003 0.000 | 0.018 |
0.000 0.000 | 0.000 |
0.000 0.000 | 0.000 |
0.081 0.066 | 0.086 |
0.000 0.000 | 0.005 |
0.917 0.905 | 0.926 |
0.000 0.000 | 0.000 |
| 1 spectrum, IYCNALALR | 0.068 | 0.000 | 0.004 | 0.119 | 0.000 | 0.000 | 0.656 | 0.153 | ||
| 2 spectra, VVYILEK | 0.000 | 0.033 | 0.000 | 0.000 | 0.006 | 0.000 | 0.961 | 0.000 | ||
| 1 spectrum, LVEEFMLLANMAVAHK | 0.000 | 0.174 | 0.000 | 0.000 | 0.000 | 0.053 | 0.773 | 0.000 | ||
| 2 spectra, DLDDALSCR | 0.000 | 0.000 | 0.000 | 0.018 | 0.006 | 0.000 | 0.976 | 0.000 | ||
| 2 spectra, ILEEWFGR | 0.000 | 0.013 | 0.000 | 0.000 | 0.024 | 0.000 | 0.963 | 0.000 | ||
| 2 spectra, GTLIQGVLR | 0.000 | 0.000 | 0.000 | 0.000 | 0.000 | 0.000 | 1.000 | 0.000 | ||
| 1 spectrum, YSAILK | 0.000 | 0.041 | 0.000 | 0.000 | 0.014 | 0.000 | 0.945 | 0.000 | ||
| 2 spectra, TFPEQALLR | 0.000 | 0.097 | 0.000 | 0.000 | 0.050 | 0.000 | 0.853 | 0.000 |
| Plot | Mito | Lyso or Perox | ER | Golgi | PM | Cytosol | Nucleus | ||||||
| Expt B |
4 peptides |
9 spectra |
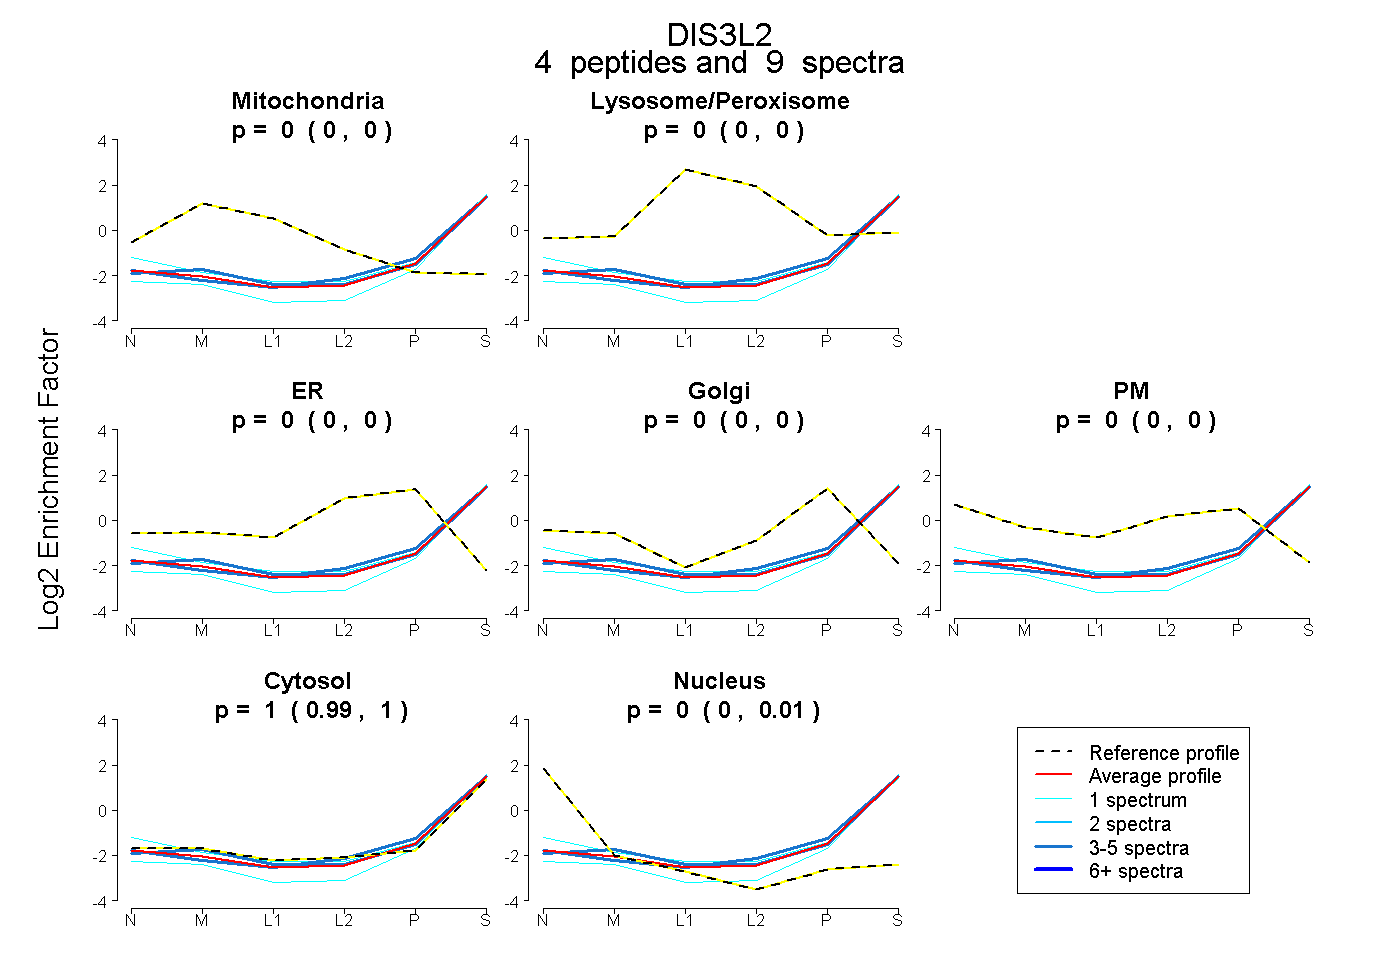 |
0.000 0.000 | 0.000 |
0.000 0.000 | 0.000 |
0.000 0.000 | 0.000 |
0.000 0.000 | 0.000 |
0.000 0.000 | 0.000 |
1.000 0.990 | 1.000 |
0.000 0.000 | 0.007 |
|||
| Plot | Lyso | Other | |||||||||||
| Expt C |
7 peptides |
11 spectra |
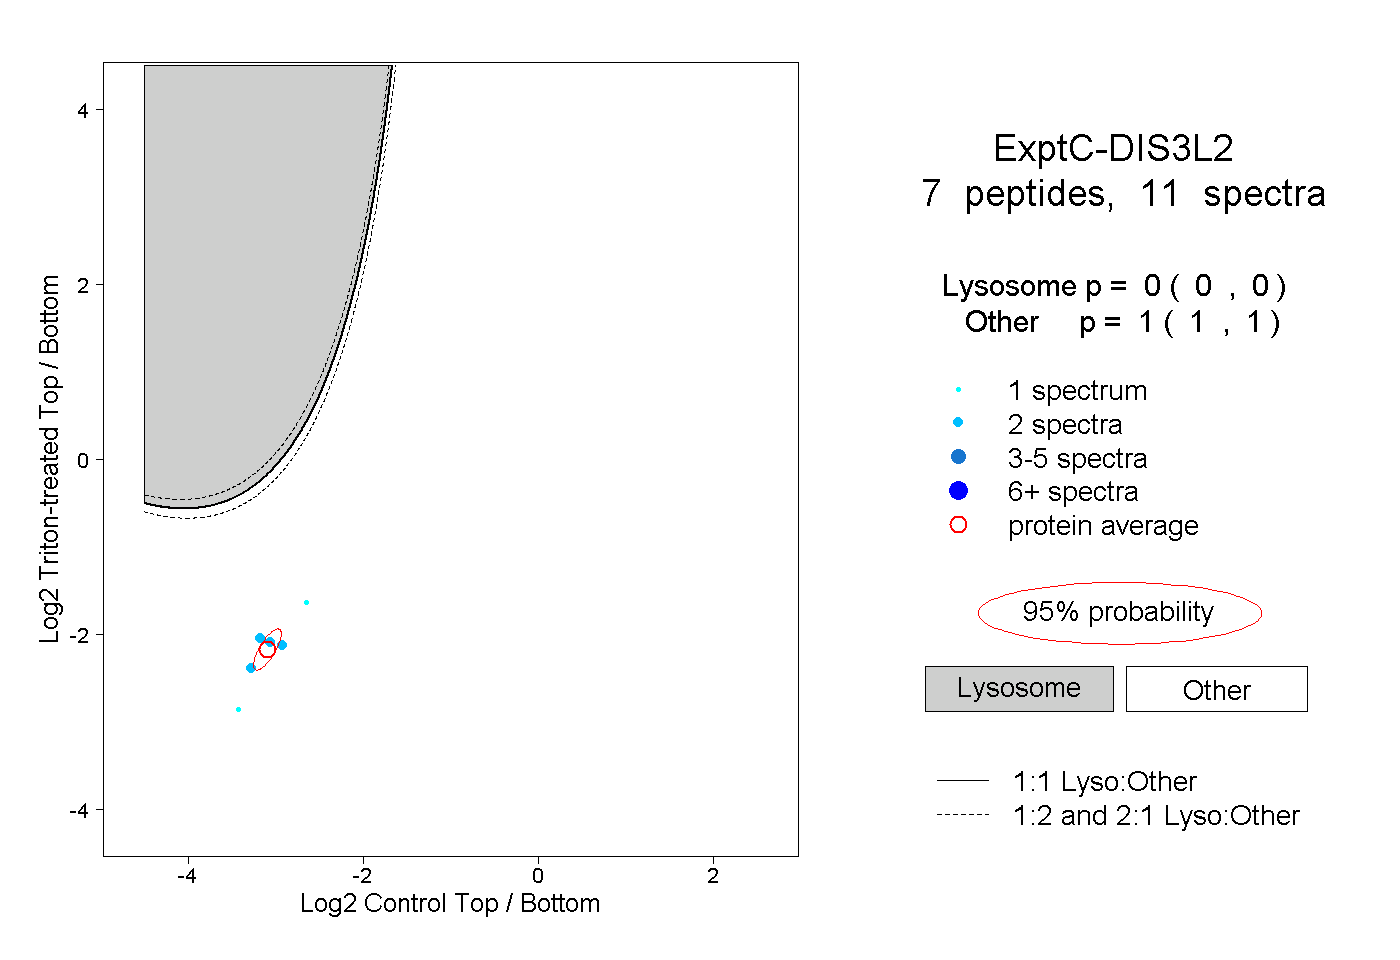 |
0.000 0.000 | 0.000 |
1.000 1.000 | 1.000 |