 11
11peptides
spectra
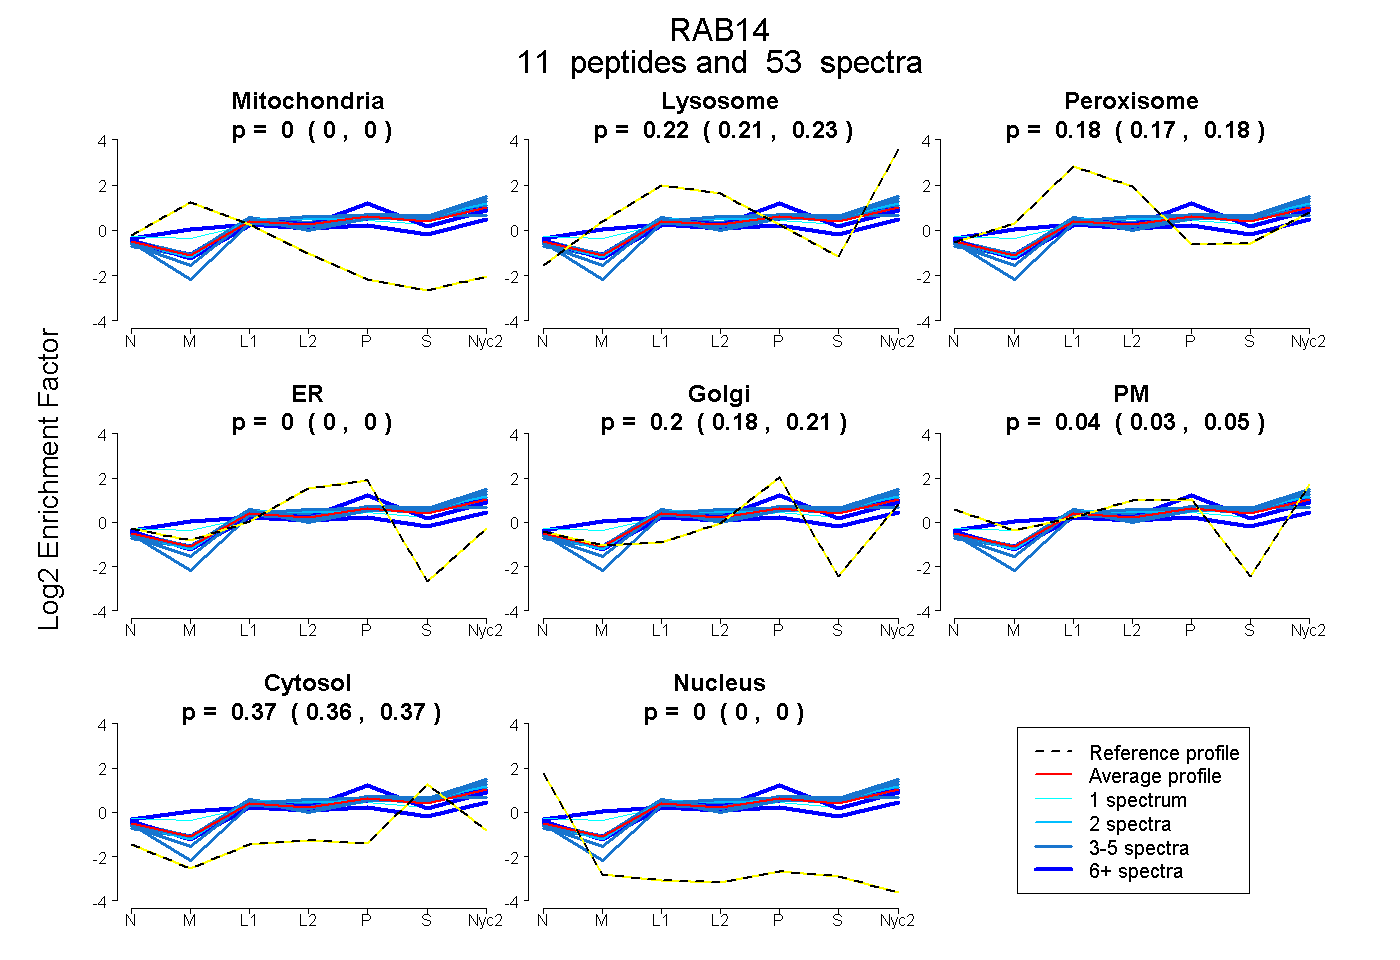
0.000 | 0.000
0.214 | 0.227
0.167 | 0.185
0.000 | 0.000
0.182 | 0.206
0.027 | 0.051
0.361 | 0.371
0.000 | 0.000
8peptides
spectra
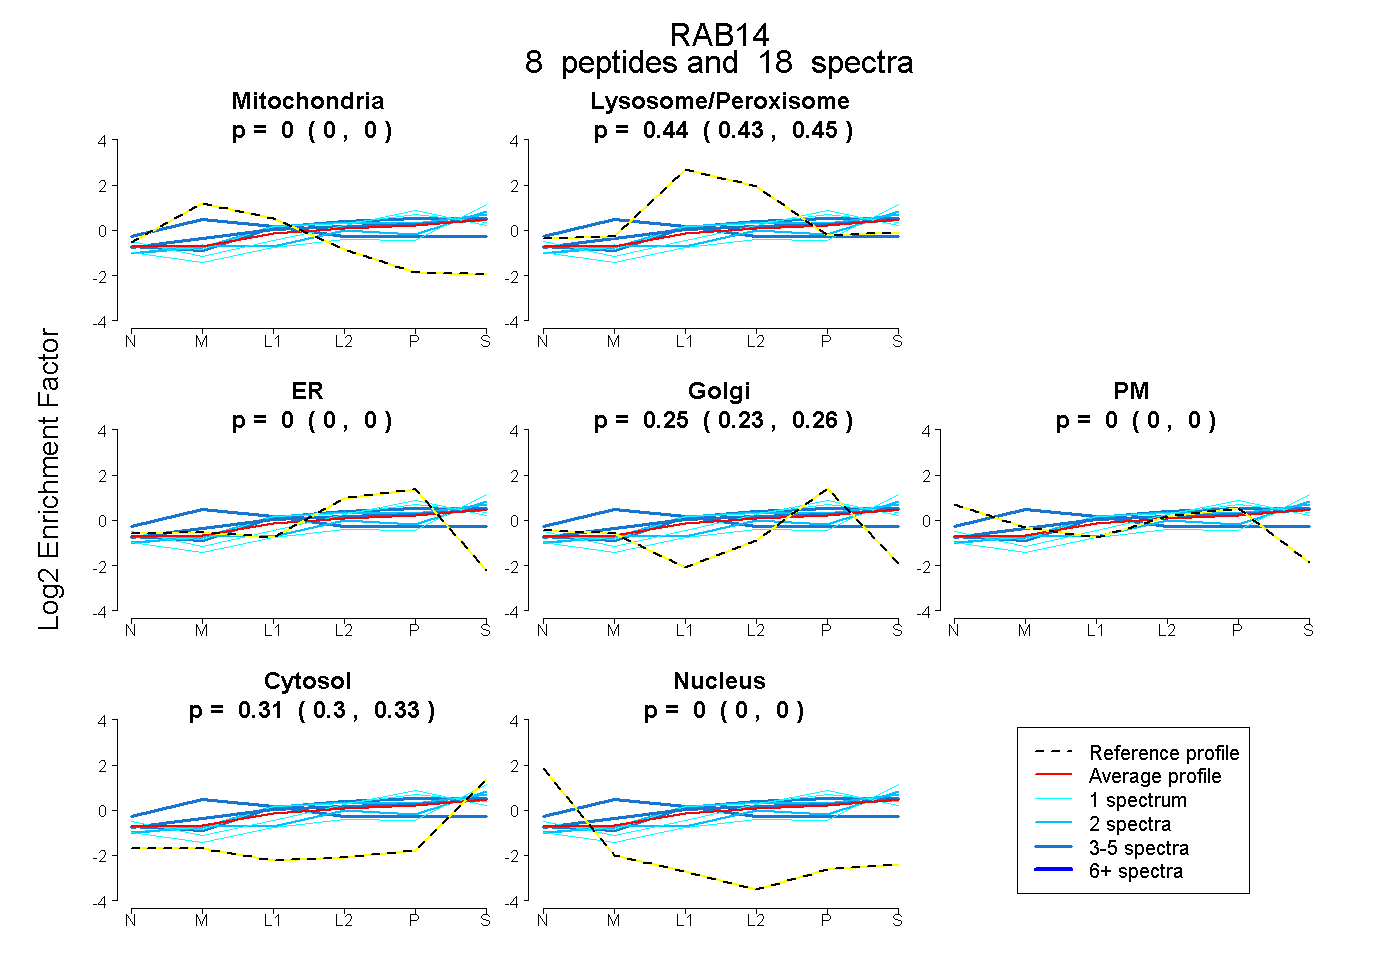
0.000 | 0.000
0.428 | 0.448
0.000 | 0.000
0.231 | 0.263
0.000 | 0.000
0.297 | 0.325
0.000 | 0.000
10peptides
spectra
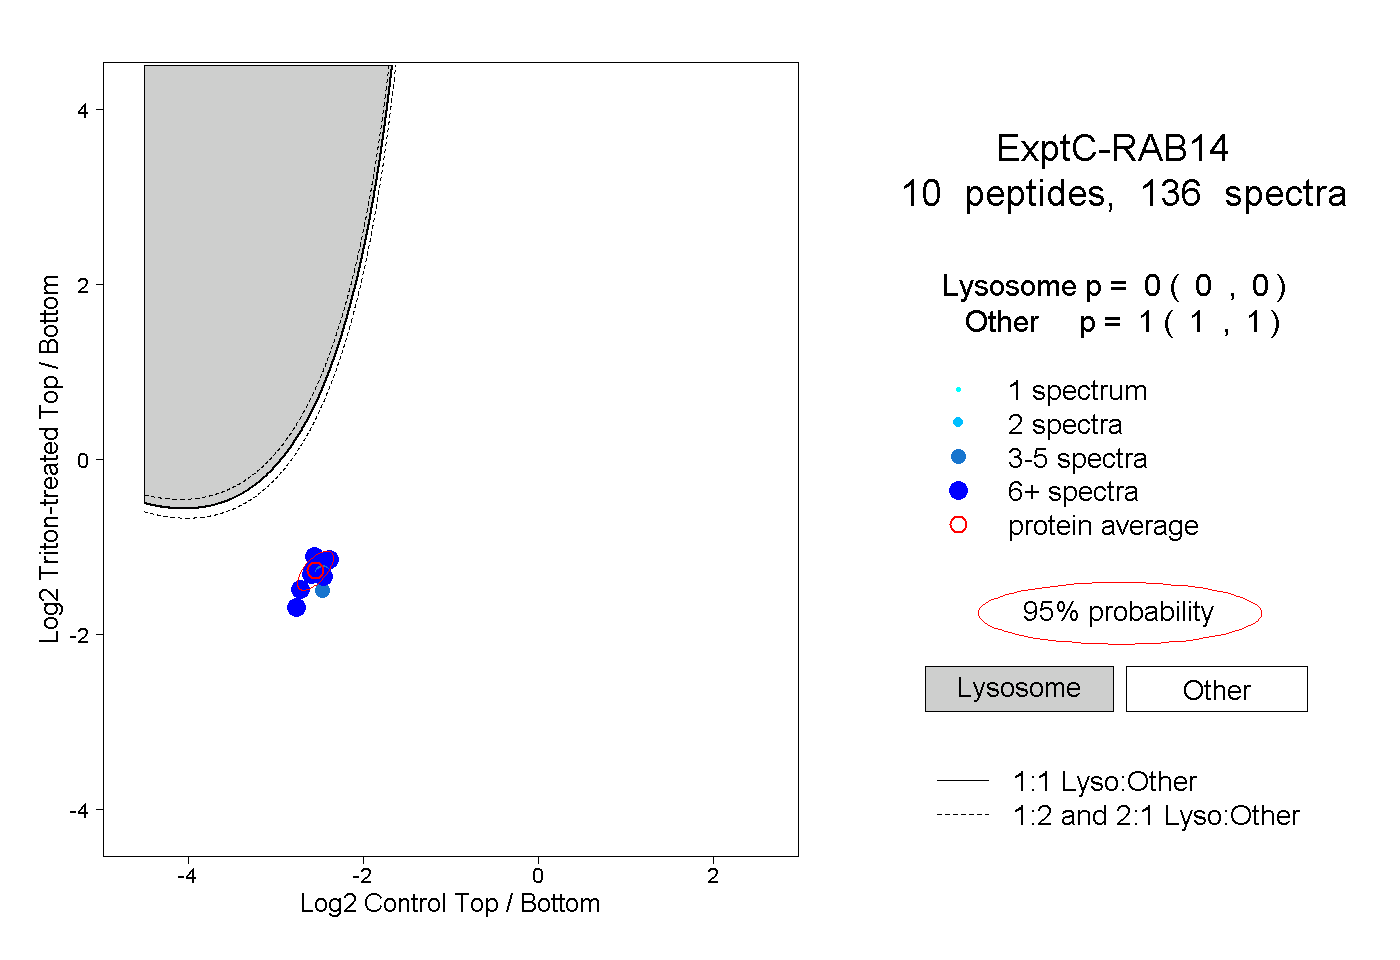
0.000 | 0.000
1.000 | 1.000
4peptides
spectra
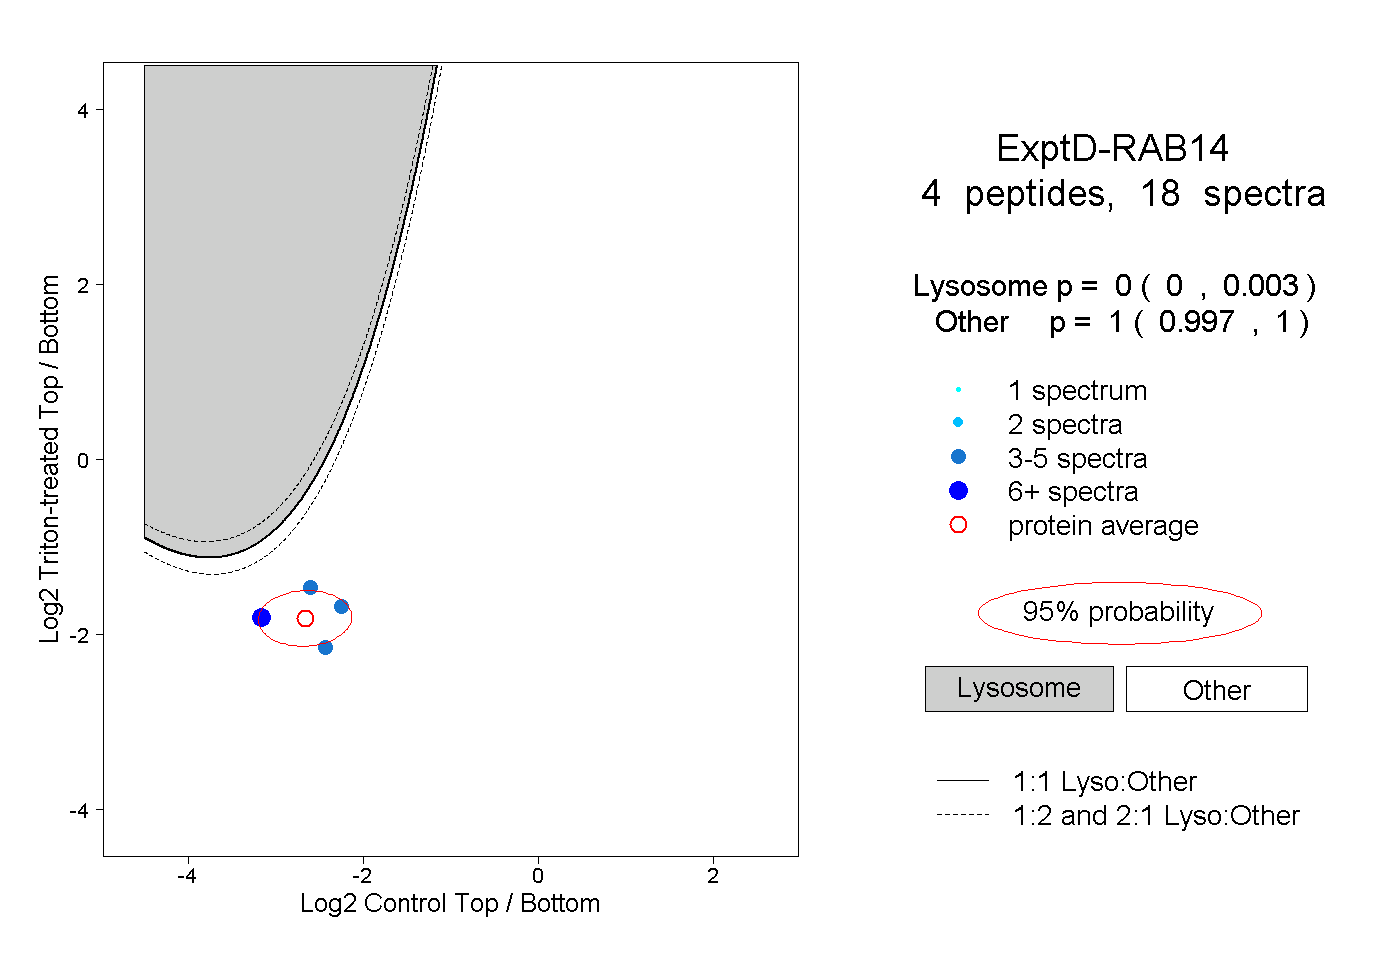
0.000 | 0.003
0.997 | 1.000