 11
11peptides
spectra
0.000 | 0.000
0.214 | 0.227
0.167 | 0.185
0.000 | 0.000
0.182 | 0.206
0.027 | 0.051
0.361 | 0.371
0.000 | 0.000
| Plot | Mito | Lyso | Perox | ER | Golgi | PM | Cytosol | Nucleus | |||||
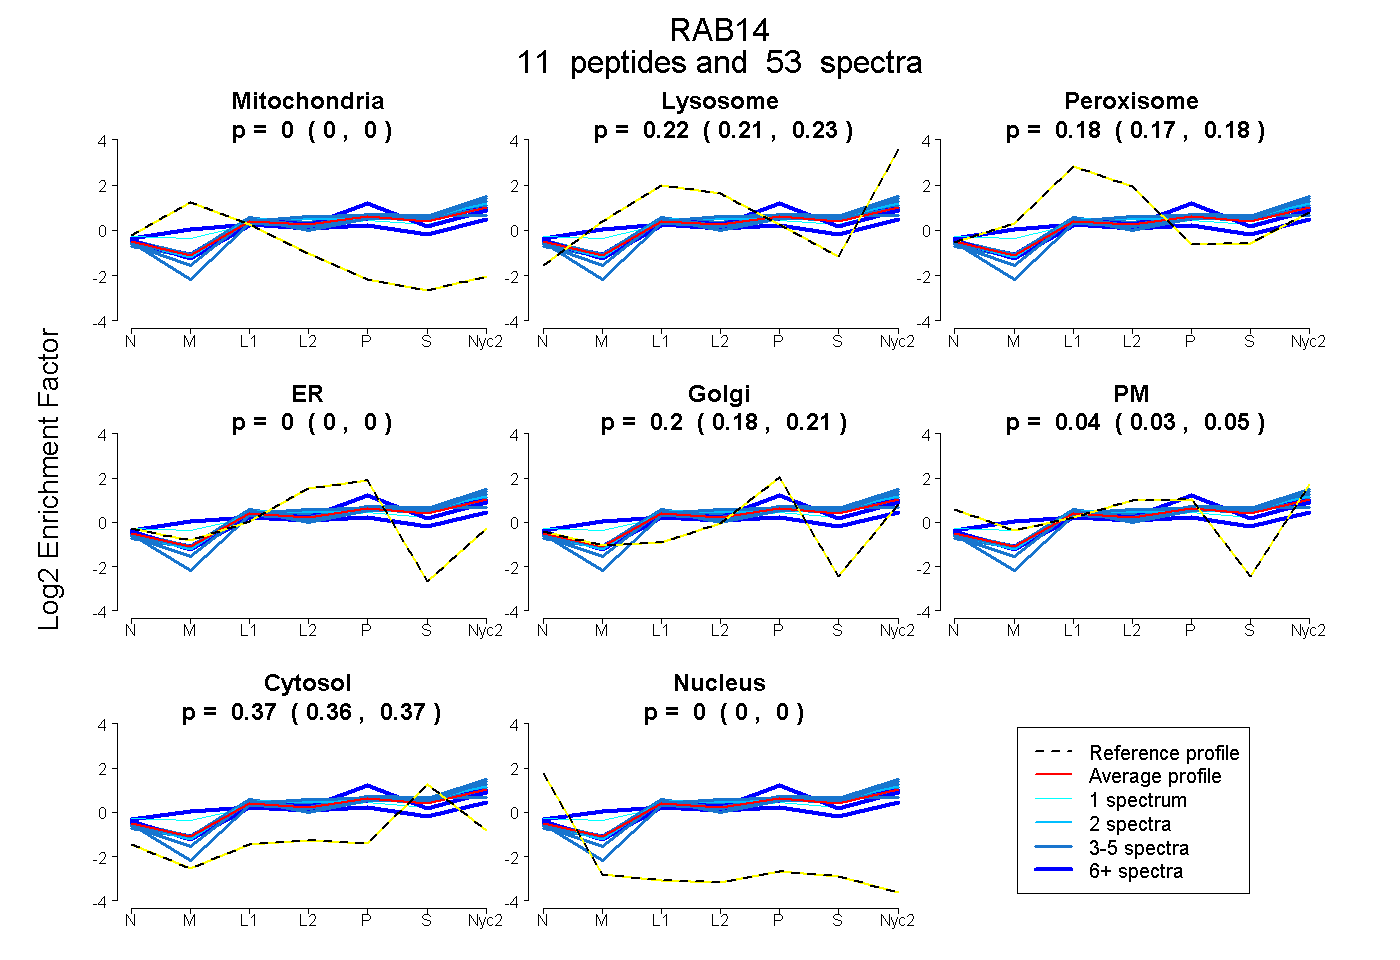
| Expt A |
11 peptides |
53 spectra |
|
0.000 0.000 | 0.000 |
0.221 0.214 | 0.227 |
0.177 0.167 | 0.185 |
0.000 0.000 | 0.000 |
0.196 0.182 | 0.206 |
0.040 0.027 | 0.051 |
0.367 0.361 | 0.371 |
0.000 0.000 | 0.000 |
| 3 spectra, GAAGALMVYDITR | 0.000 | 0.283 | 0.127 | 0.000 | 0.089 | 0.117 | 0.384 | 0.000 | ||
| 1 spectrum, ATAPYNYSYIFK | 0.000 | 0.152 | 0.193 | 0.000 | 0.089 | 0.220 | 0.346 | 0.000 | ||
| 5 spectra, TGENVEDAFLEAAK | 0.000 | 0.340 | 0.095 | 0.000 | 0.101 | 0.099 | 0.366 | 0.000 | ||
| 2 spectra, QFAEENGLLFLEASAK | 0.000 | 0.274 | 0.167 | 0.000 | 0.095 | 0.078 | 0.386 | 0.000 | ||
| 6 spectra, FMADCPHTIGVEFGTR | 0.000 | 0.228 | 0.206 | 0.000 | 0.185 | 0.000 | 0.381 | 0.000 | ||
| 8 spectra, ADLEAQR | 0.069 | 0.066 | 0.292 | 0.000 | 0.203 | 0.103 | 0.267 | 0.000 | ||
| 5 spectra, IIEVSGQK | 0.000 | 0.248 | 0.150 | 0.000 | 0.206 | 0.000 | 0.396 | 0.000 | ||
| 14 spectra, LQIWDTAGQER | 0.000 | 0.150 | 0.172 | 0.000 | 0.383 | 0.000 | 0.295 | 0.000 | ||
| 3 spectra, DVTYEEAK | 0.000 | 0.258 | 0.188 | 0.000 | 0.198 | 0.000 | 0.356 | 0.000 | ||
| 3 spectra, LTSEPQPQR | 0.000 | 0.139 | 0.161 | 0.035 | 0.200 | 0.000 | 0.464 | 0.000 | ||
| 3 spectra, YIIIGDMGVGK | 0.000 | 0.391 | 0.007 | 0.000 | 0.067 | 0.083 | 0.452 | 0.000 |
| Plot | Mito | Lyso or Perox | ER | Golgi | PM | Cytosol | Nucleus | ||||||
| Expt B |
8 peptides |
18 spectra |
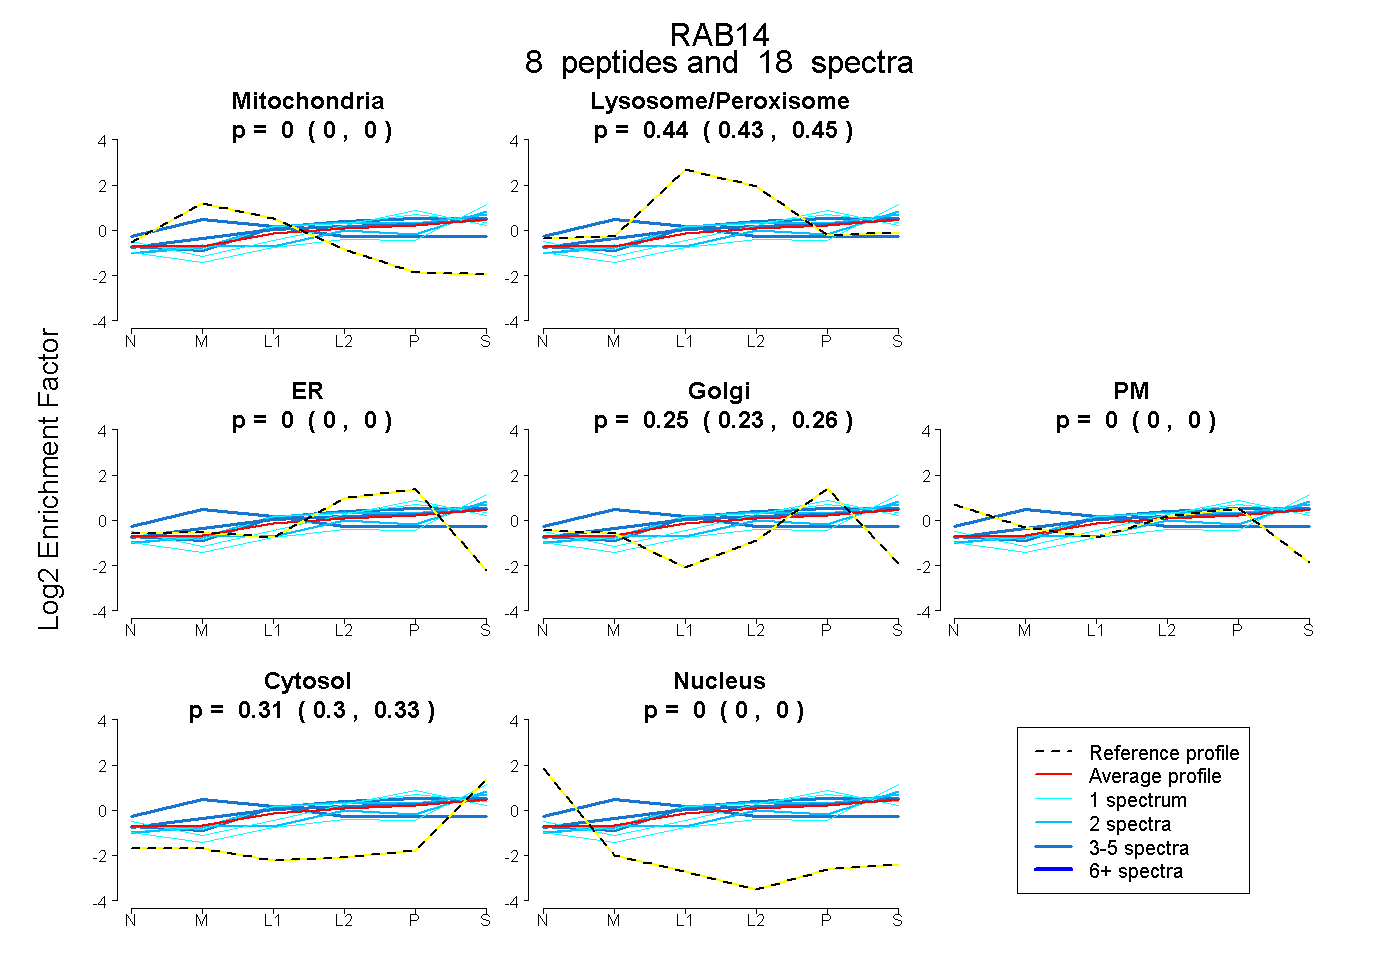 |
0.000 0.000 | 0.000 |
0.439 0.428 | 0.448 |
0.000 0.000 | 0.000 |
0.249 0.231 | 0.263 |
0.000 0.000 | 0.000 |
0.312 0.297 | 0.325 |
0.000 0.000 | 0.000 |
|||
| Plot | Lyso | Other | |||||||||||
| Expt C |
10 peptides |
136 spectra |
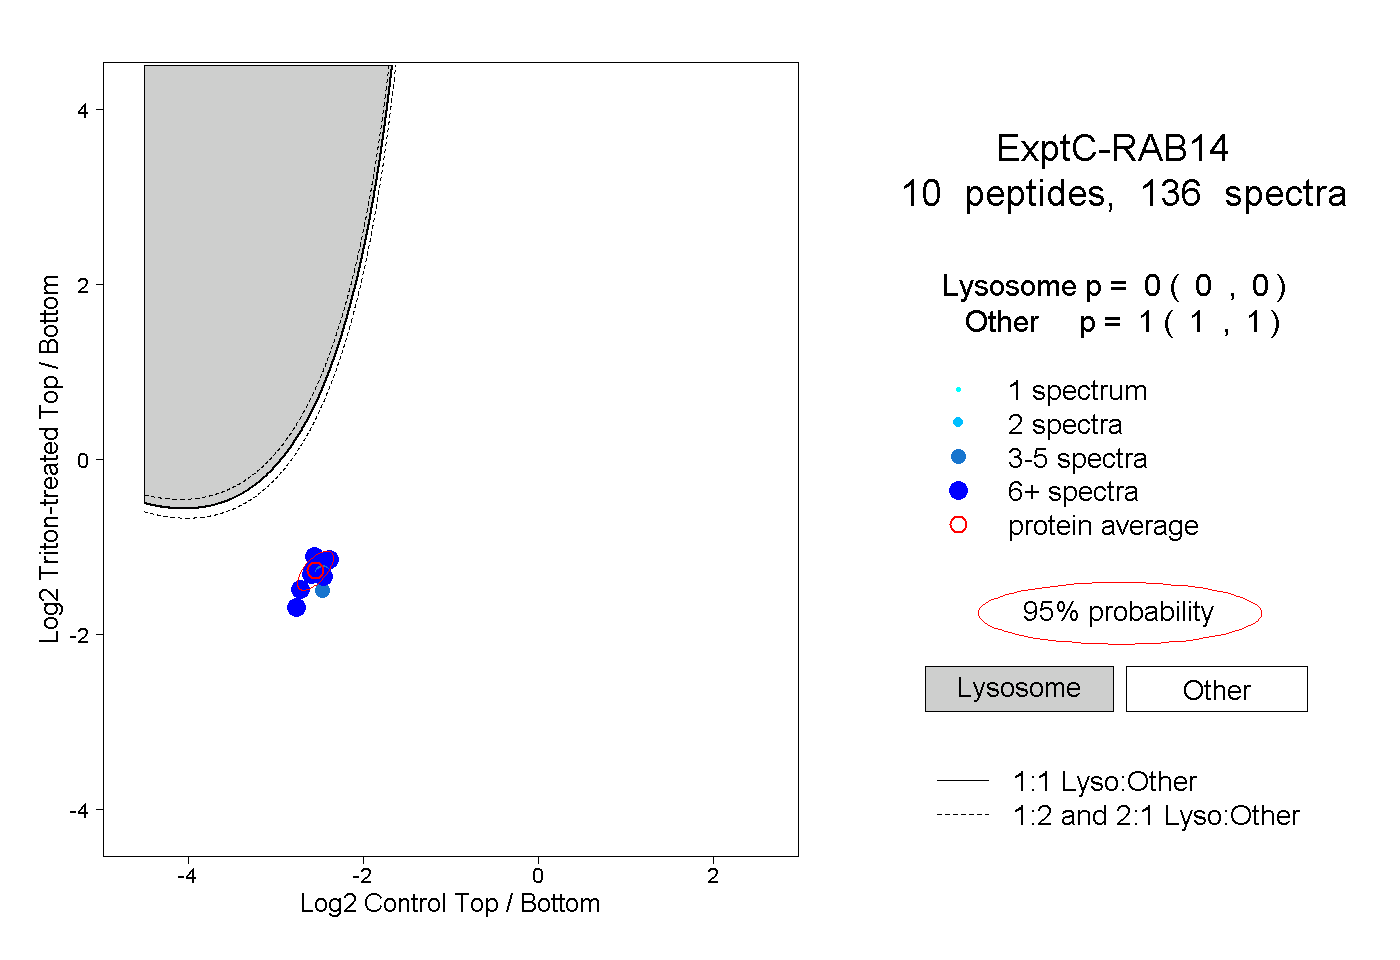 |
0.000 0.000 | 0.000 |
1.000 1.000 | 1.000 |
||||||||
| Plot | Lyso | Other | |||||||||||
| Expt D |
4 peptides |
18 spectra |
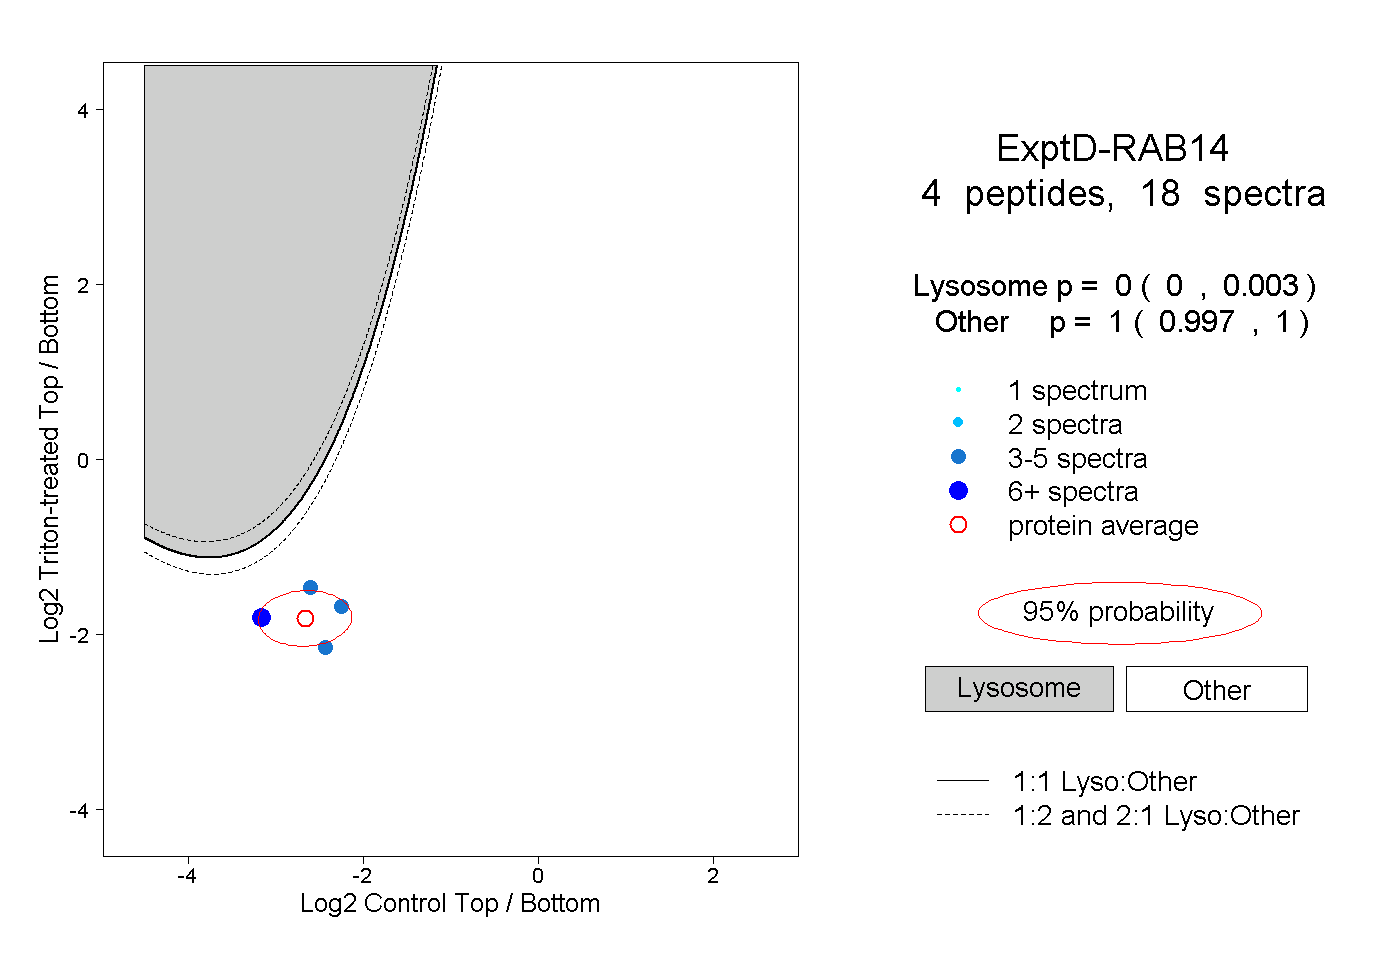 |
0.000 0.000 | 0.003 |
1.000 0.997 | 1.000 |