 4
4peptides
spectra
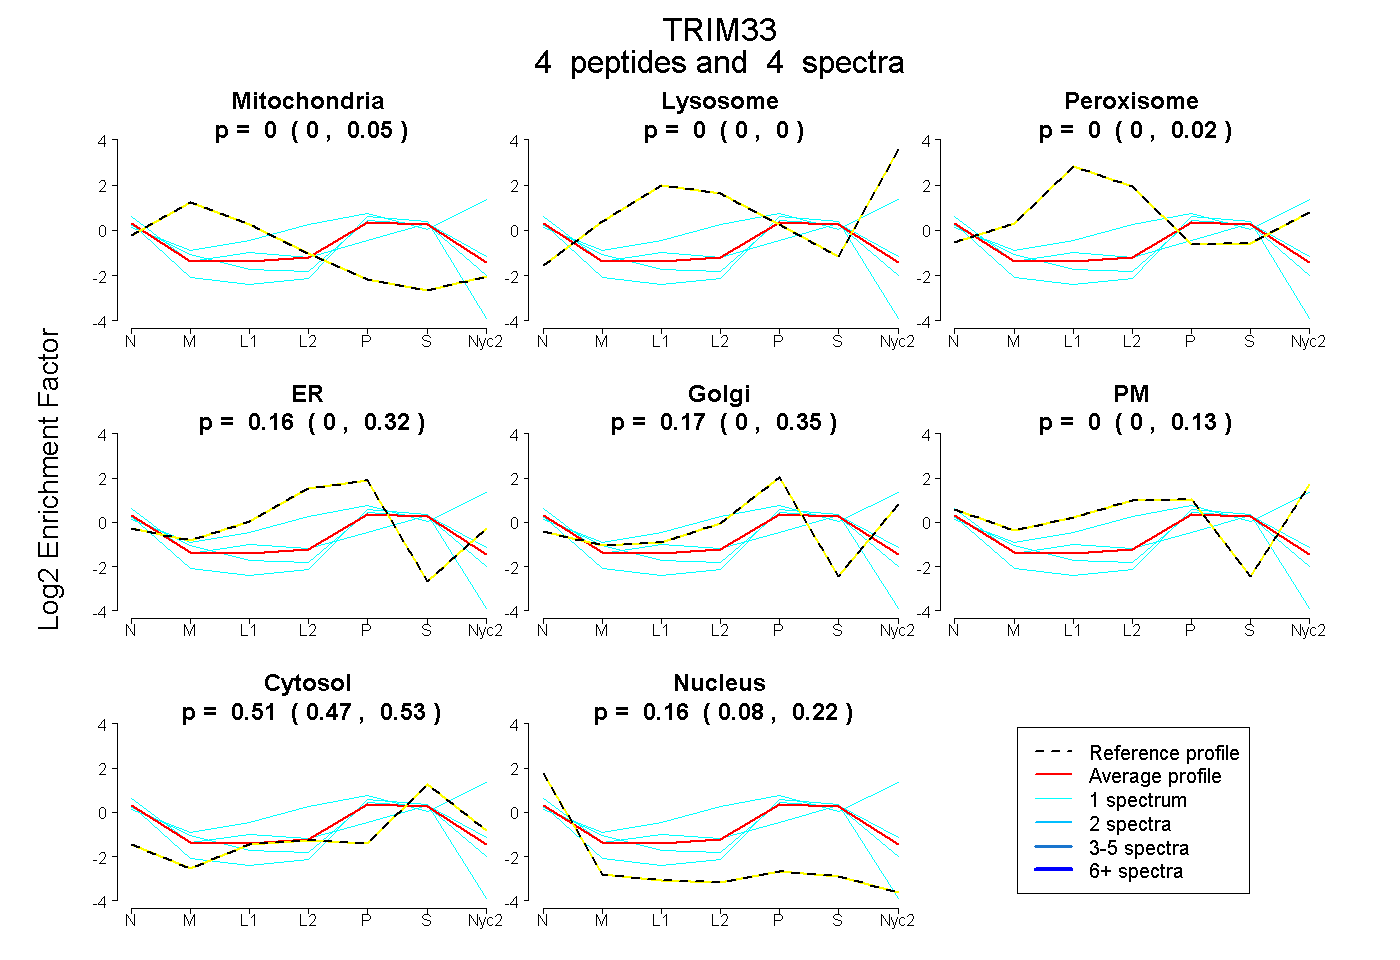
0.000 | 0.051
0.000 | 0.000
0.000 | 0.022
0.000 | 0.323
0.000 | 0.351
0.000 | 0.127
0.470 | 0.530
0.076 | 0.224
1peptide
spectra
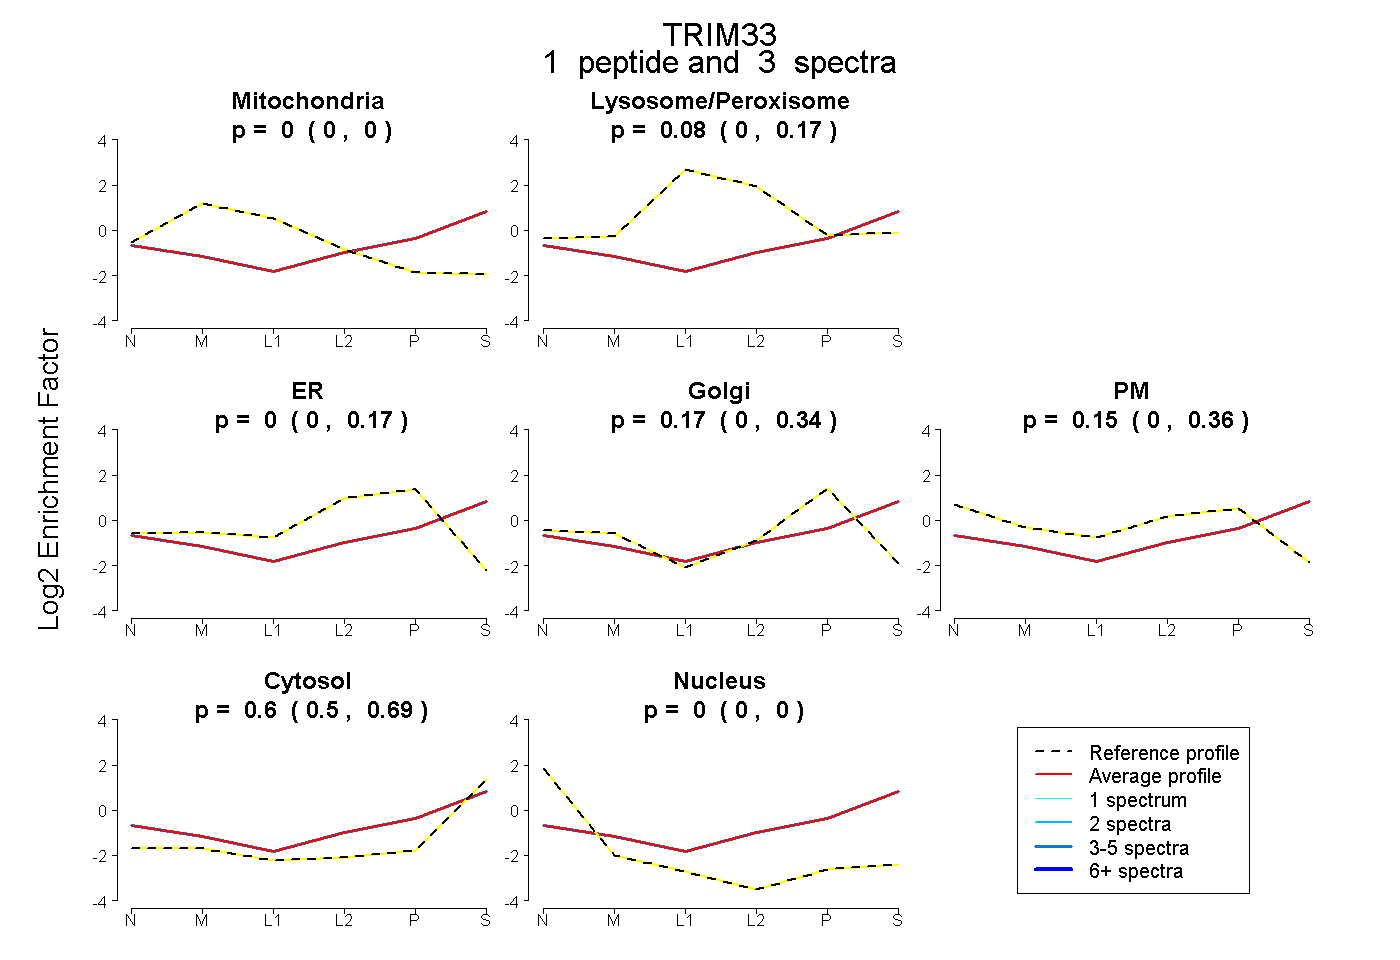
0.000 | 0.000
0.000 | 0.168
0.000 | 0.173
0.000 | 0.345
0.000 | 0.356
0.499 | 0.690
0.000 | 0.000