 4
4peptides
spectra
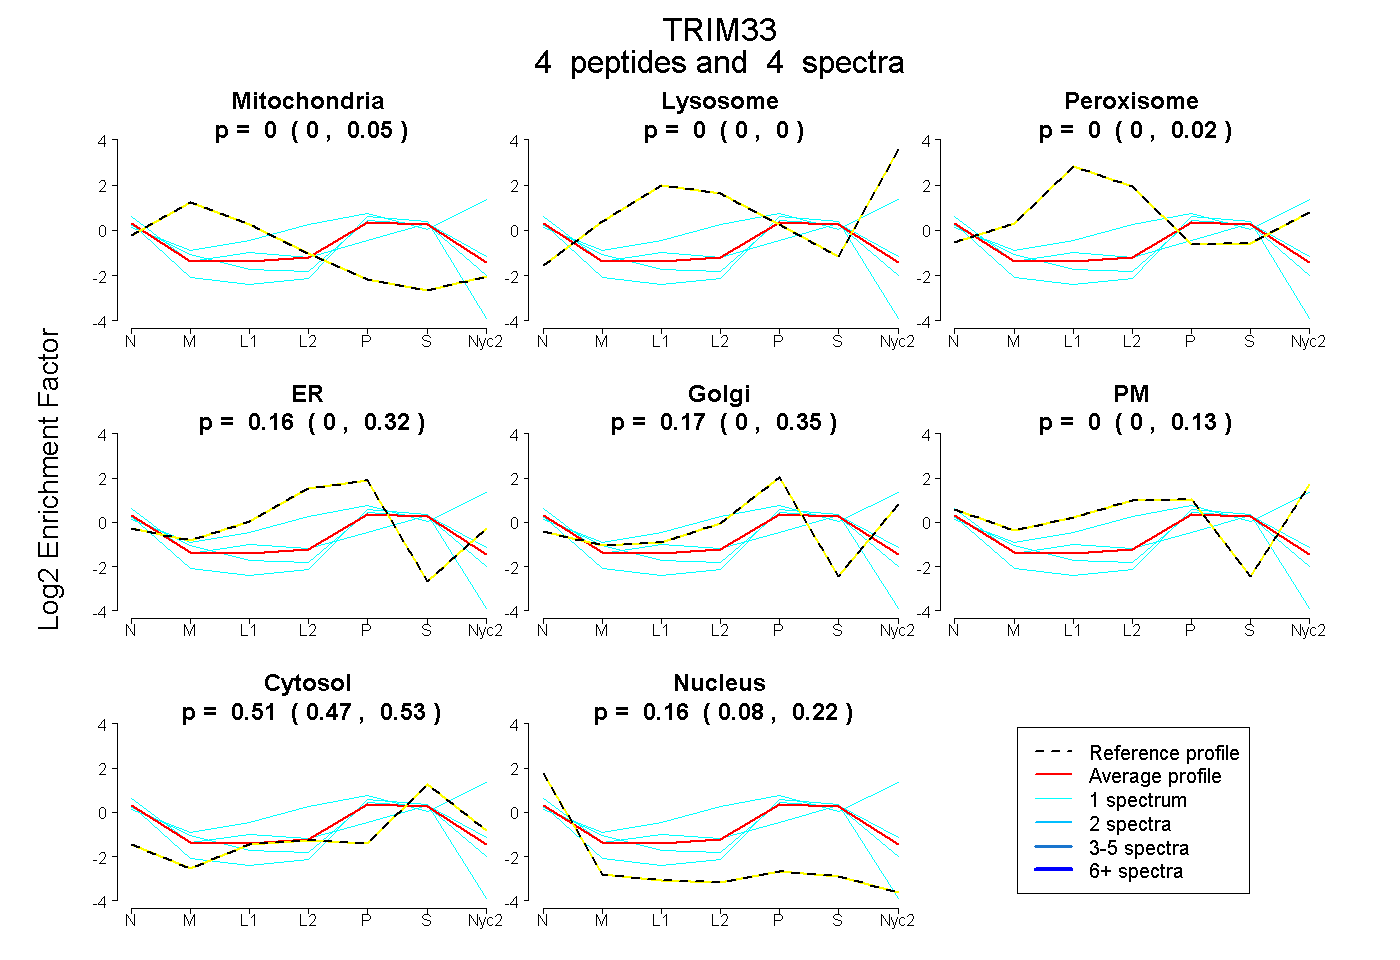
0.000 | 0.051
0.000 | 0.000
0.000 | 0.022
0.000 | 0.323
0.000 | 0.351
0.000 | 0.127
0.470 | 0.530
0.076 | 0.224
| Plot | Mito | Lyso | Perox | ER | Golgi | PM | Cytosol | Nucleus | |||||
| Expt A |
4 peptides |
4 spectra |
|
0.000 0.000 | 0.051 |
0.000 0.000 | 0.000 |
0.000 0.000 | 0.022 |
0.164 0.000 | 0.323 |
0.173 0.000 | 0.351 |
0.000 0.000 | 0.127 |
0.508 0.470 | 0.530 |
0.156 0.076 | 0.224 |
| 1 spectrum, NYVHFAATQVQNR | 0.000 | 0.119 | 0.000 | 0.000 | 0.002 | 0.514 | 0.365 | 0.000 | ||
| 1 spectrum, VVQVYADTQEINLK | 0.000 | 0.000 | 0.102 | 0.000 | 0.005 | 0.188 | 0.492 | 0.212 | ||
| 1 spectrum, LITFQLR | 0.054 | 0.000 | 0.000 | 0.002 | 0.267 | 0.000 | 0.476 | 0.202 | ||
| 1 spectrum, LLQQQNDITGLSR | 0.000 | 0.000 | 0.000 | 0.116 | 0.000 | 0.000 | 0.476 | 0.408 |
| Plot | Mito | Lyso or Perox | ER | Golgi | PM | Cytosol | Nucleus | ||||||
| Expt B |
1 peptide |
3 spectra |
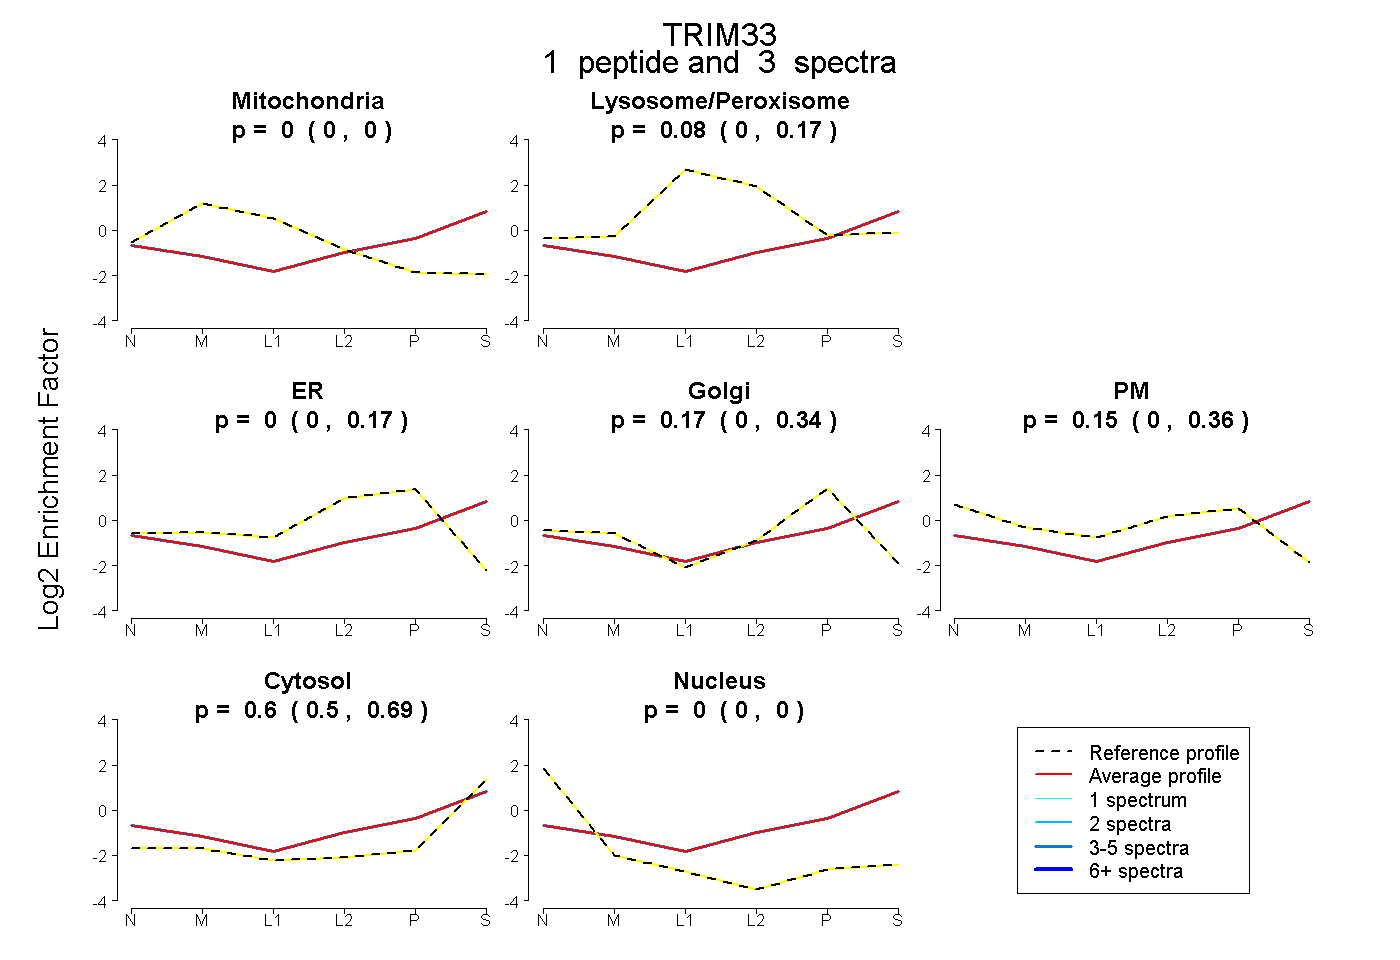 |
0.000 0.000 | 0.000 |
0.083 0.000 | 0.168 |
0.000 0.000 | 0.173 |
0.171 0.000 | 0.345 |
0.146 0.000 | 0.356 |
0.599 0.499 | 0.690 |
0.000 0.000 | 0.000 |