 9
9peptides
spectra
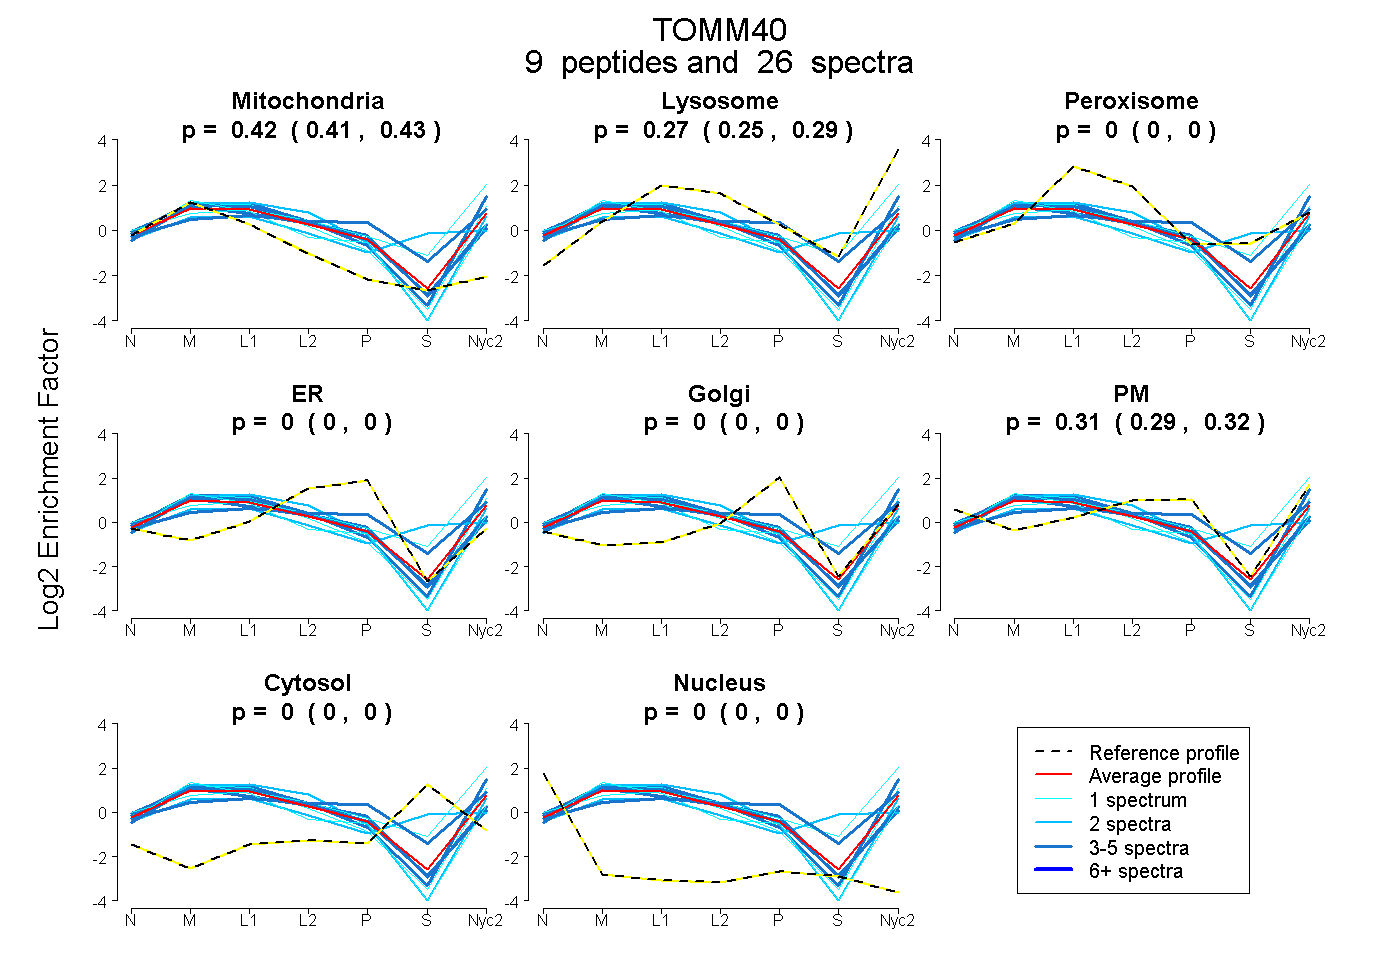
0.407 | 0.430
0.254 | 0.289
0.000 | 0.000
0.000 | 0.000
0.000 | 0.000
0.285 | 0.325
0.000 | 0.000
0.000 | 0.000
3peptides
spectra
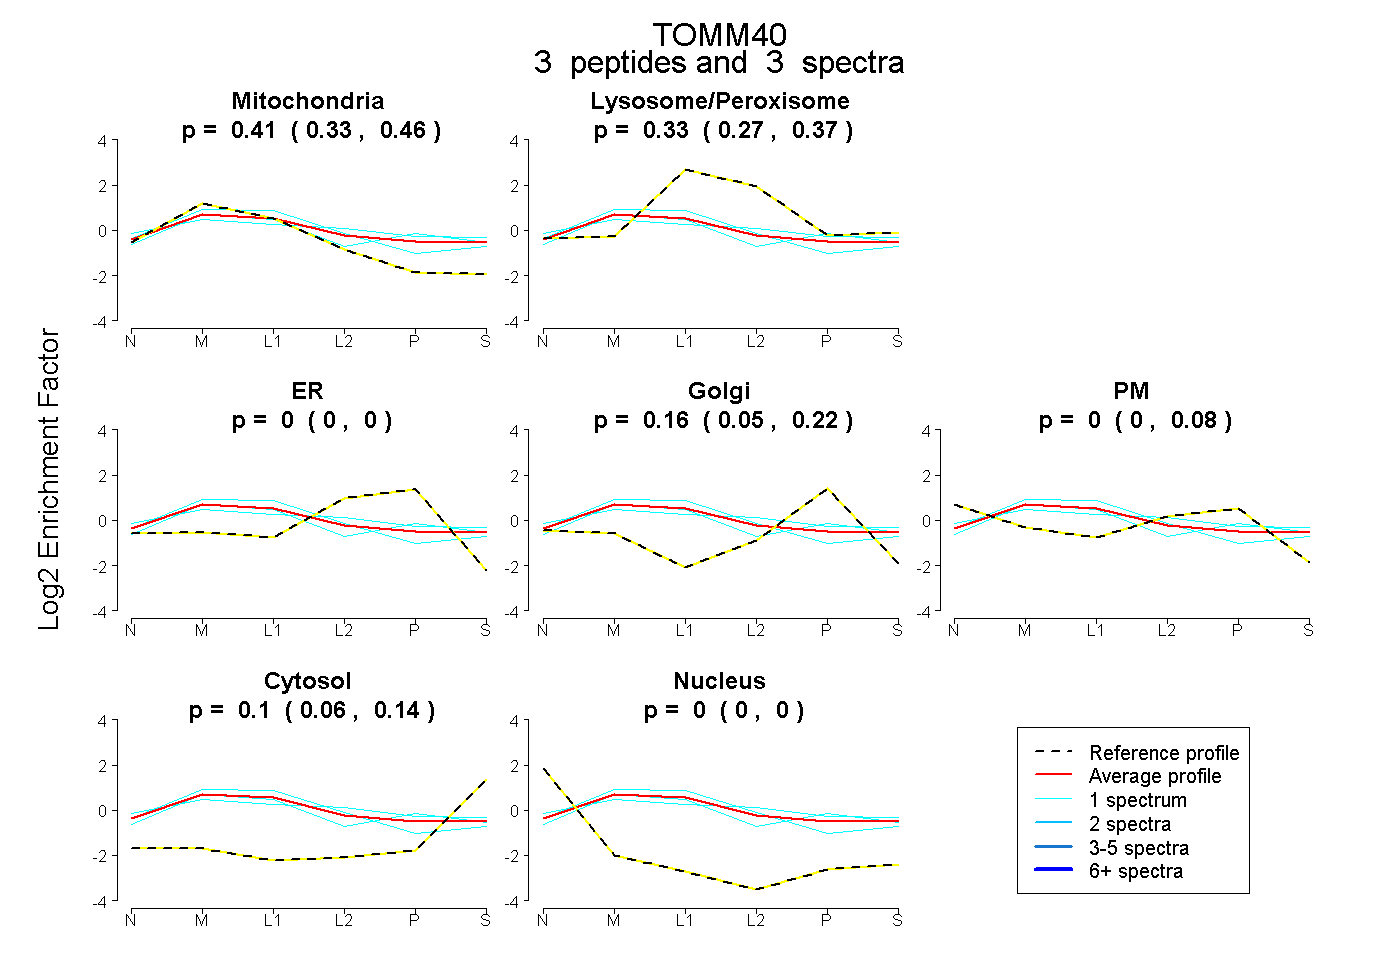
0.334 | 0.461
0.274 | 0.372
0.000 | 0.000
0.049 | 0.219
0.000 | 0.084
0.057 | 0.138
0.000 | 0.000
7peptides
spectra
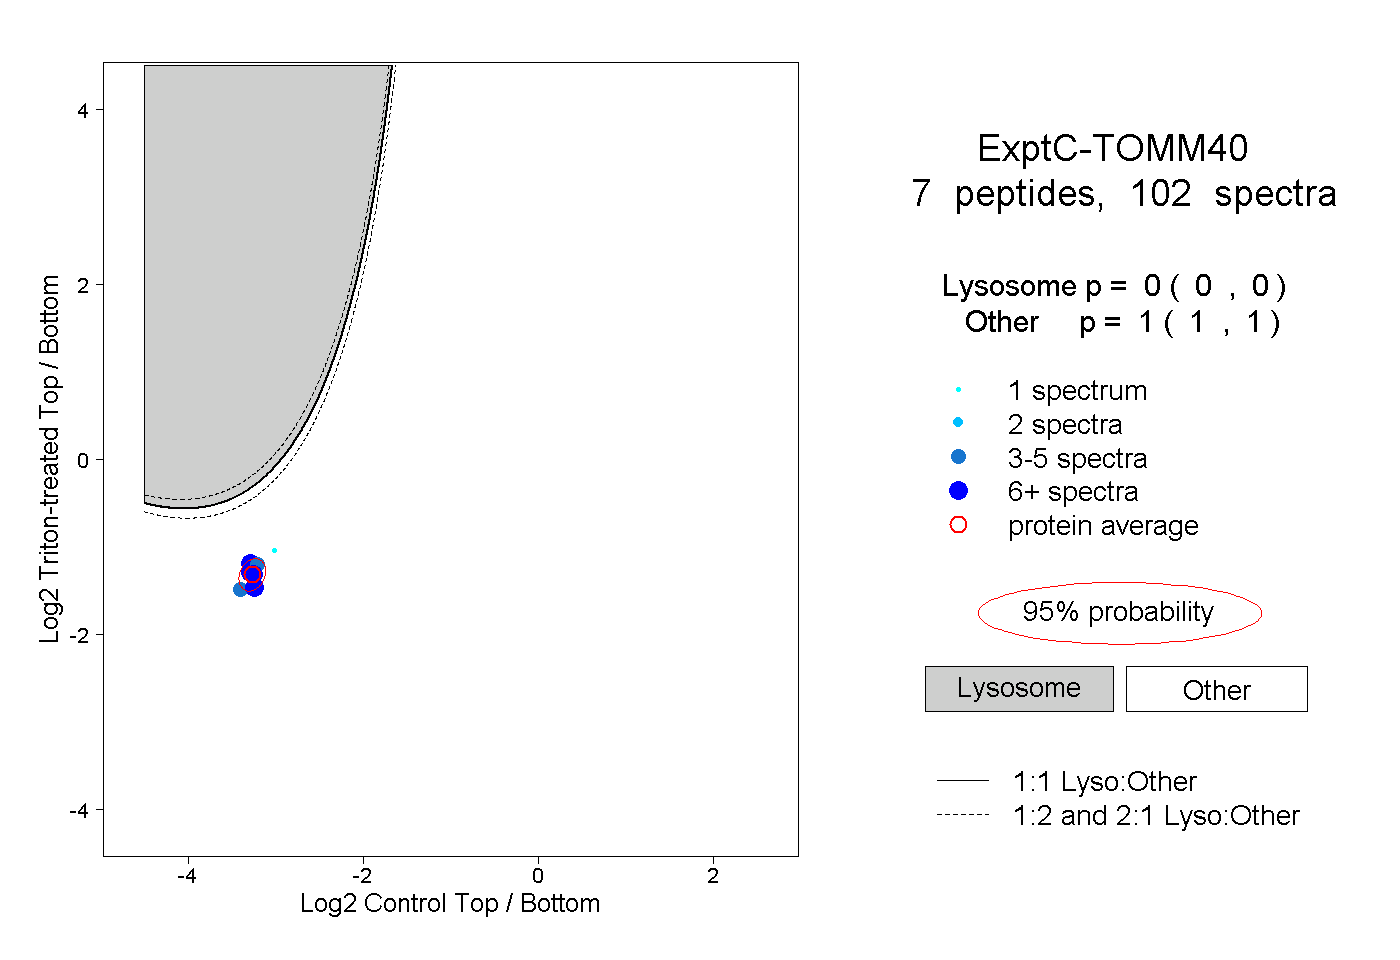
0.000 | 0.000
1.000 | 1.000
4peptides
spectra
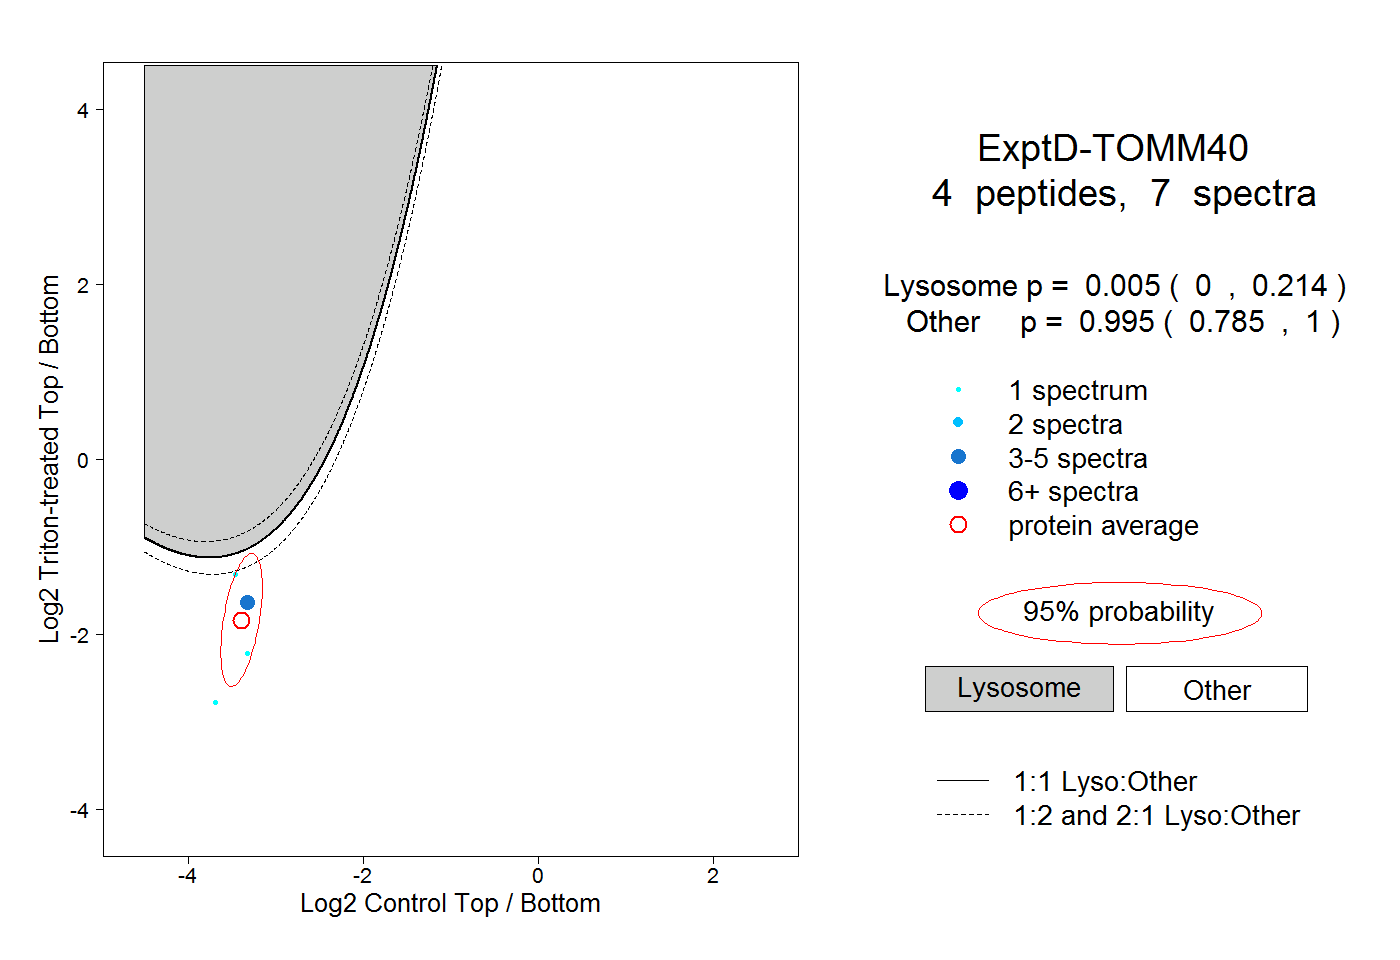
0.000 | 0.214
0.785 | 1.000