 12
12peptides
spectra
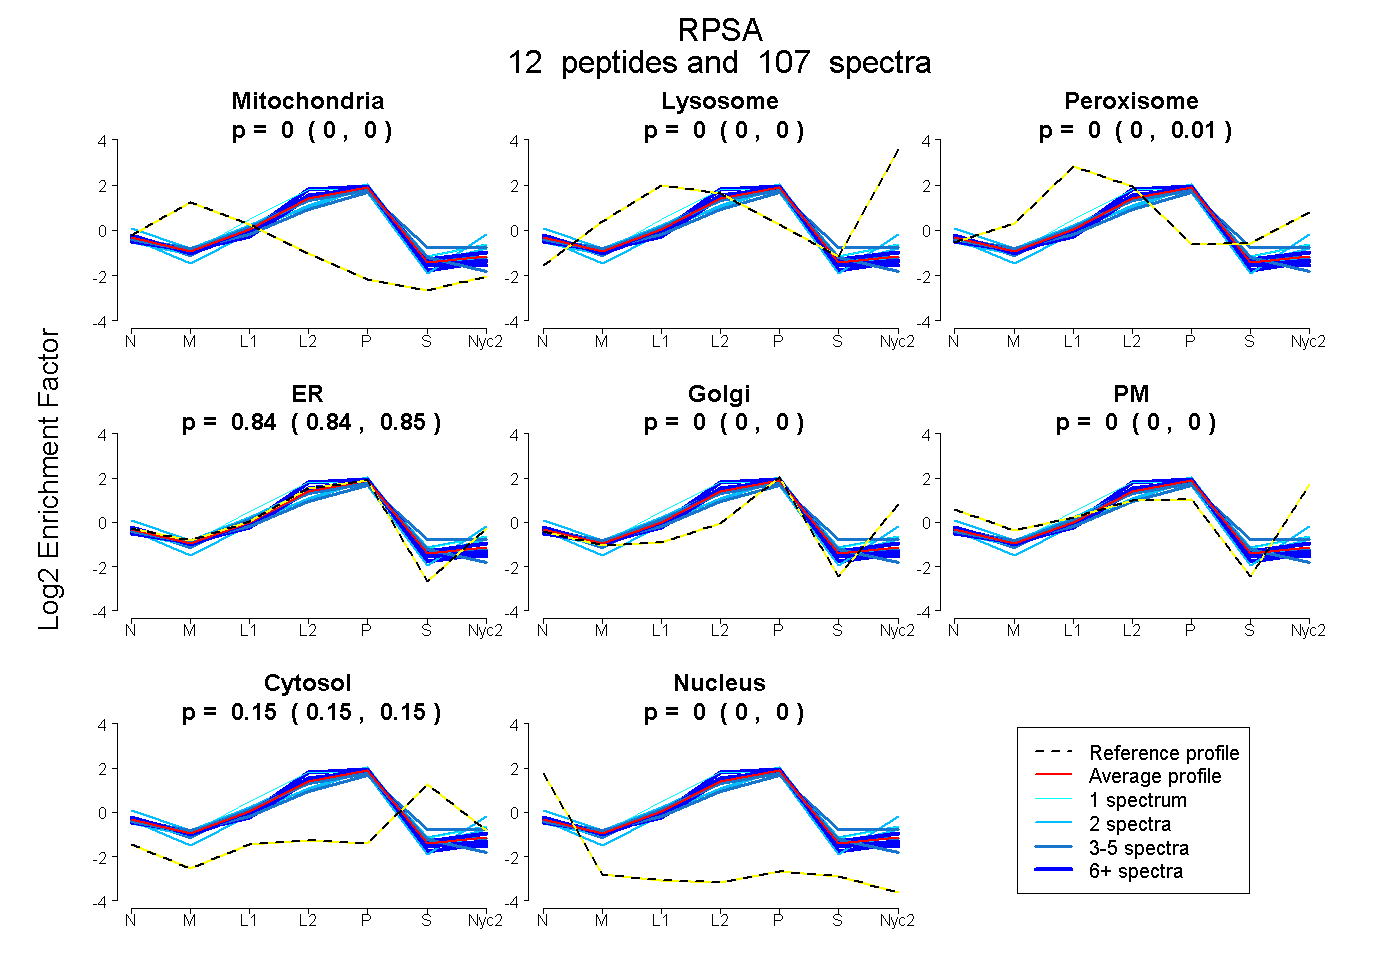
0.000 | 0.000
0.000 | 0.000
0.002 | 0.007
0.841 | 0.846
0.000 | 0.000
0.000 | 0.000
0.150 | 0.153
0.000 | 0.000
9peptides
spectra
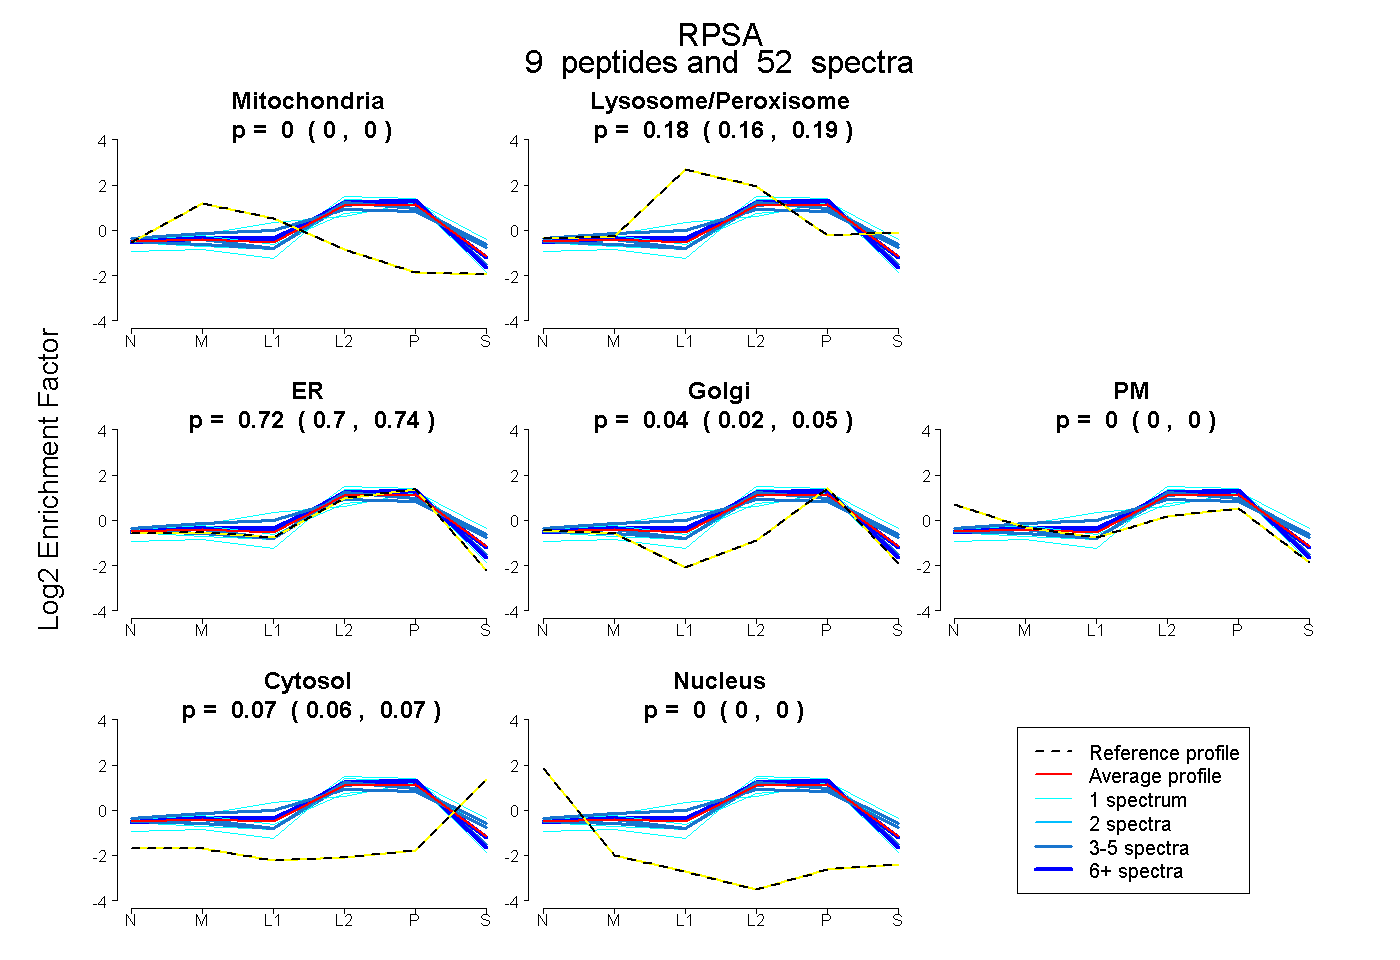
0.000 | 0.000
0.164 | 0.187
0.696 | 0.741
0.016 | 0.051
0.000 | 0.000
0.060 | 0.074
0.000 | 0.000
13peptides
spectra
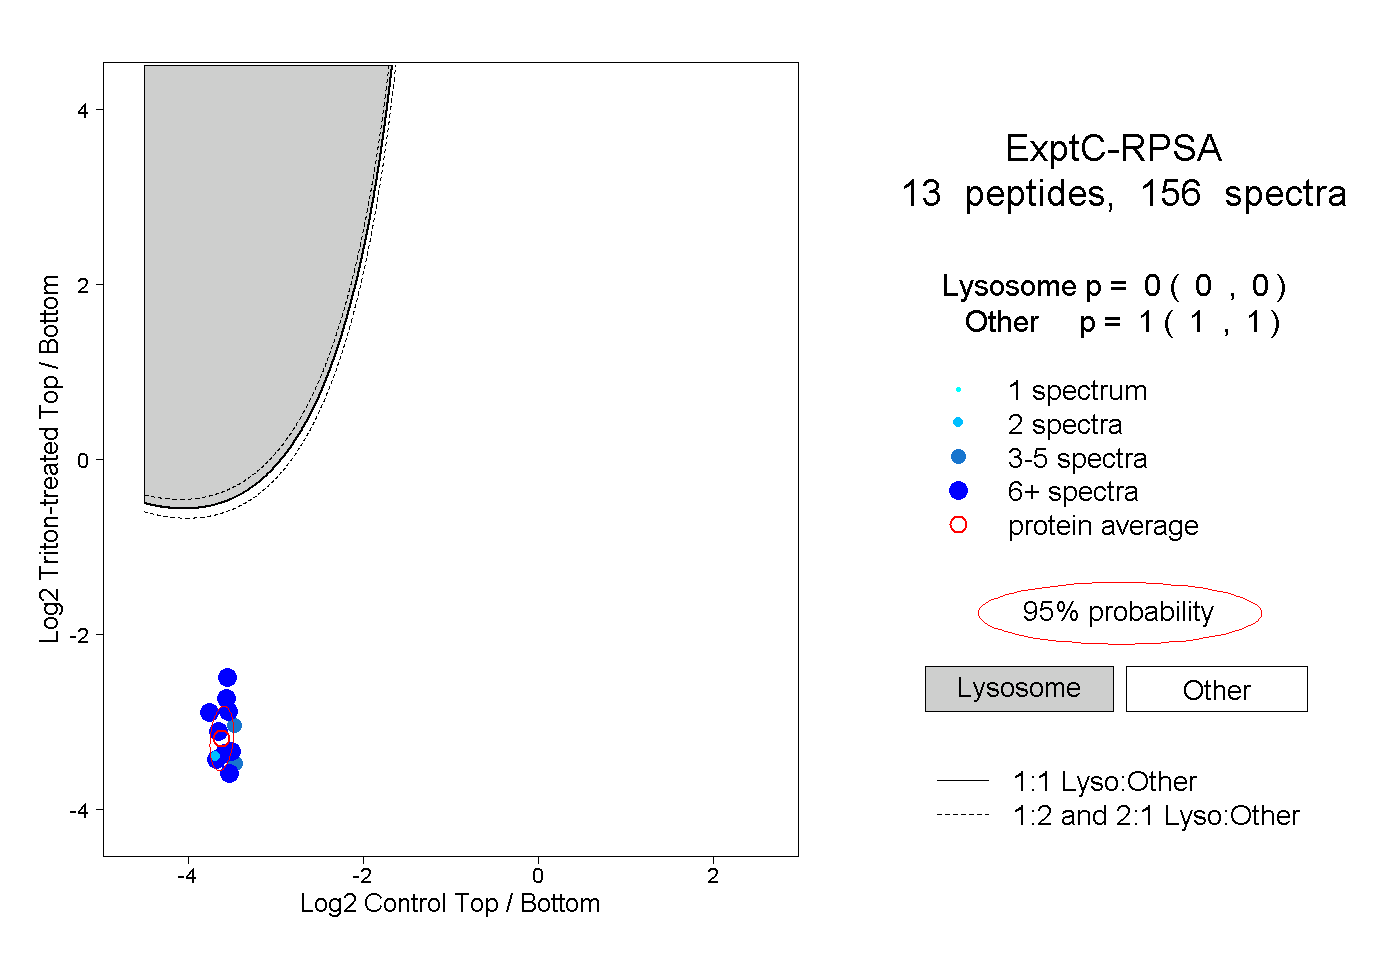
0.000 | 0.000
1.000 | 1.000
4peptides
spectra
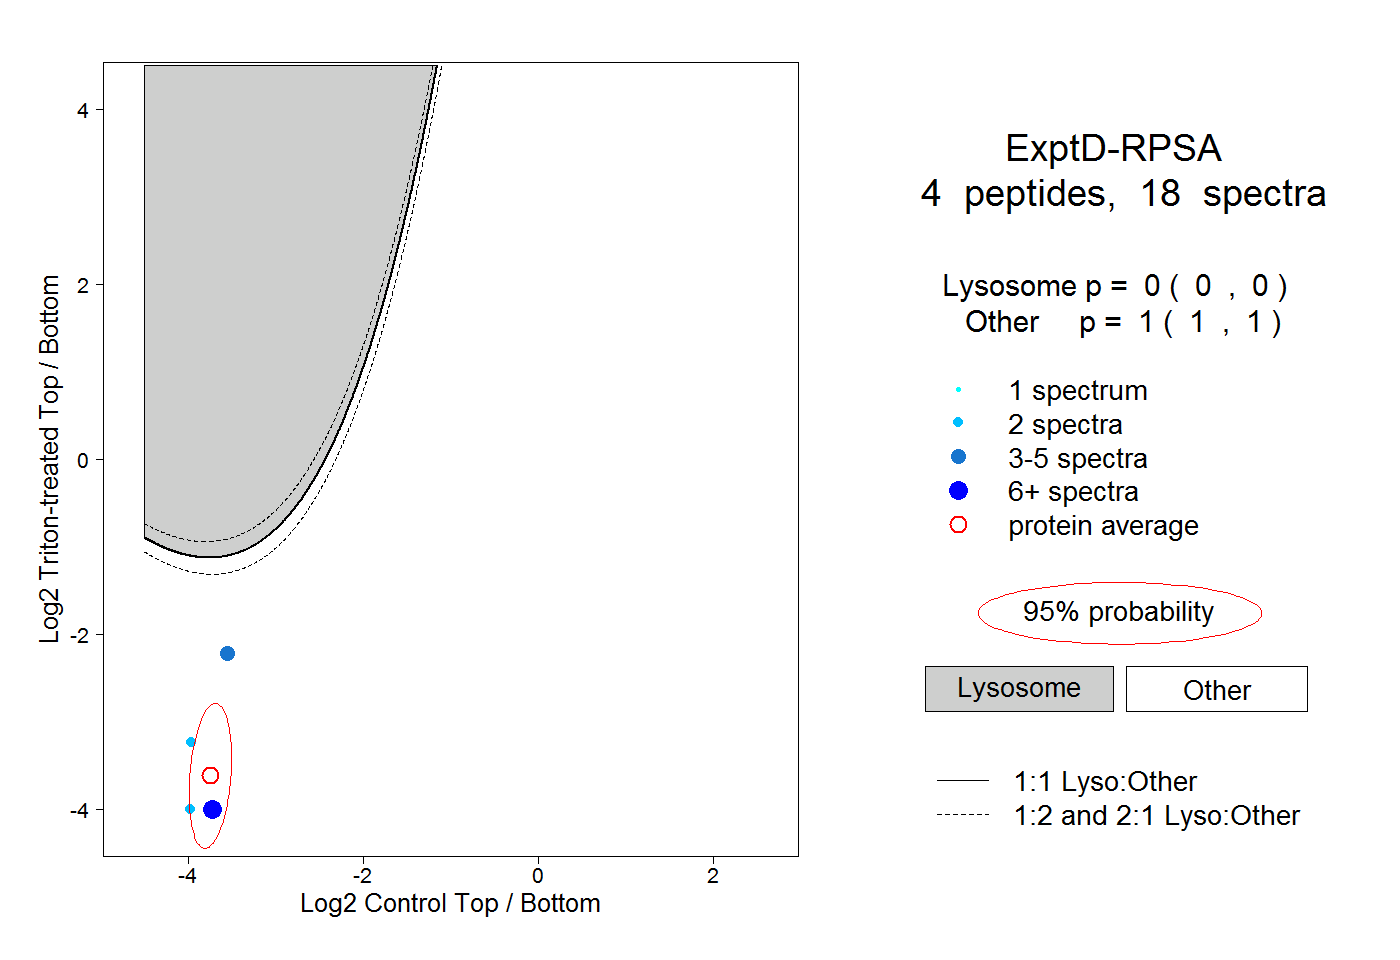
0.000 | 0.000
1.000 | 1.000