 12
12peptides
spectra
0.000 | 0.000
0.000 | 0.000
0.002 | 0.007
0.841 | 0.846
0.000 | 0.000
0.000 | 0.000
0.150 | 0.153
0.000 | 0.000
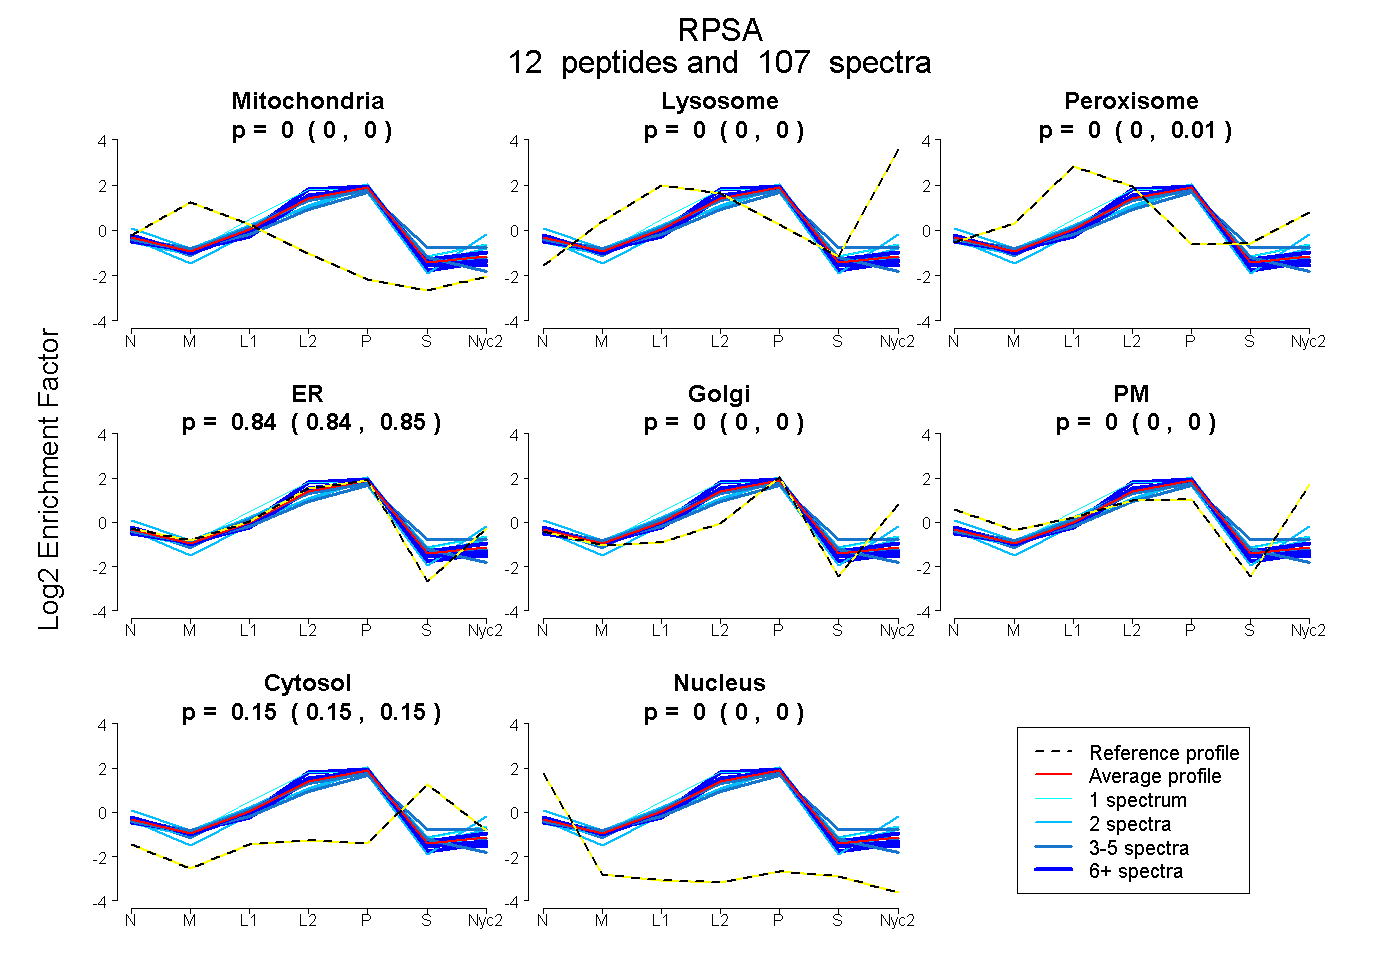
| Plot | Mito | Lyso | Perox | ER | Golgi | PM | Cytosol | Nucleus | |||||
| Expt A |
12 peptides |
107 spectra |
|
0.000 0.000 | 0.000 |
0.000 0.000 | 0.000 |
0.005 0.002 | 0.007 |
0.843 0.841 | 0.846 |
0.000 0.000 | 0.000 |
0.000 0.000 | 0.000 |
0.152 0.150 | 0.153 |
0.000 0.000 | 0.000 |
| 2 spectra, EEQAAAEK | 0.000 | 0.000 | 0.000 | 0.834 | 0.000 | 0.000 | 0.166 | 0.000 | ||
| 31 spectra, ILLAAR | 0.000 | 0.000 | 0.000 | 0.861 | 0.000 | 0.000 | 0.139 | 0.000 | ||
| 5 spectra, YVDIAIPCNNK | 0.018 | 0.000 | 0.000 | 0.797 | 0.000 | 0.000 | 0.185 | 0.000 | ||
| 8 spectra, SDGIYIINLK | 0.000 | 0.000 | 0.033 | 0.820 | 0.000 | 0.000 | 0.148 | 0.000 | ||
| 11 spectra, FTPGTFTNQIQAAFR | 0.000 | 0.000 | 0.000 | 0.834 | 0.000 | 0.000 | 0.166 | 0.000 | ||
| 3 spectra, LLVVTDPR | 0.000 | 0.000 | 0.039 | 0.710 | 0.000 | 0.000 | 0.251 | 0.000 | ||
| 2 spectra, EHPWEVMPDLYFYR | 0.000 | 0.000 | 0.035 | 0.772 | 0.000 | 0.000 | 0.193 | 0.000 | ||
| 1 spectrum, FLAAGTHLGGTNLDFQMEQYIYK | 0.000 | 0.000 | 0.157 | 0.747 | 0.000 | 0.000 | 0.096 | 0.000 | ||
| 3 spectra, AIVAIENPADVSVISSR | 0.000 | 0.000 | 0.029 | 0.812 | 0.000 | 0.000 | 0.160 | 0.000 | ||
| 2 spectra, GAHSVGLMWWMLAR | 0.000 | 0.000 | 0.078 | 0.801 | 0.000 | 0.064 | 0.058 | 0.000 | ||
| 2 spectra, DPEEIEK | 0.000 | 0.000 | 0.000 | 0.837 | 0.000 | 0.000 | 0.163 | 0.000 | ||
| 37 spectra, FAAATGATPIAGR | 0.000 | 0.000 | 0.000 | 0.909 | 0.000 | 0.000 | 0.091 | 0.000 |
| Plot | Mito | Lyso or Perox | ER | Golgi | PM | Cytosol | Nucleus | ||||||
| Expt B |
9 peptides |
52 spectra |
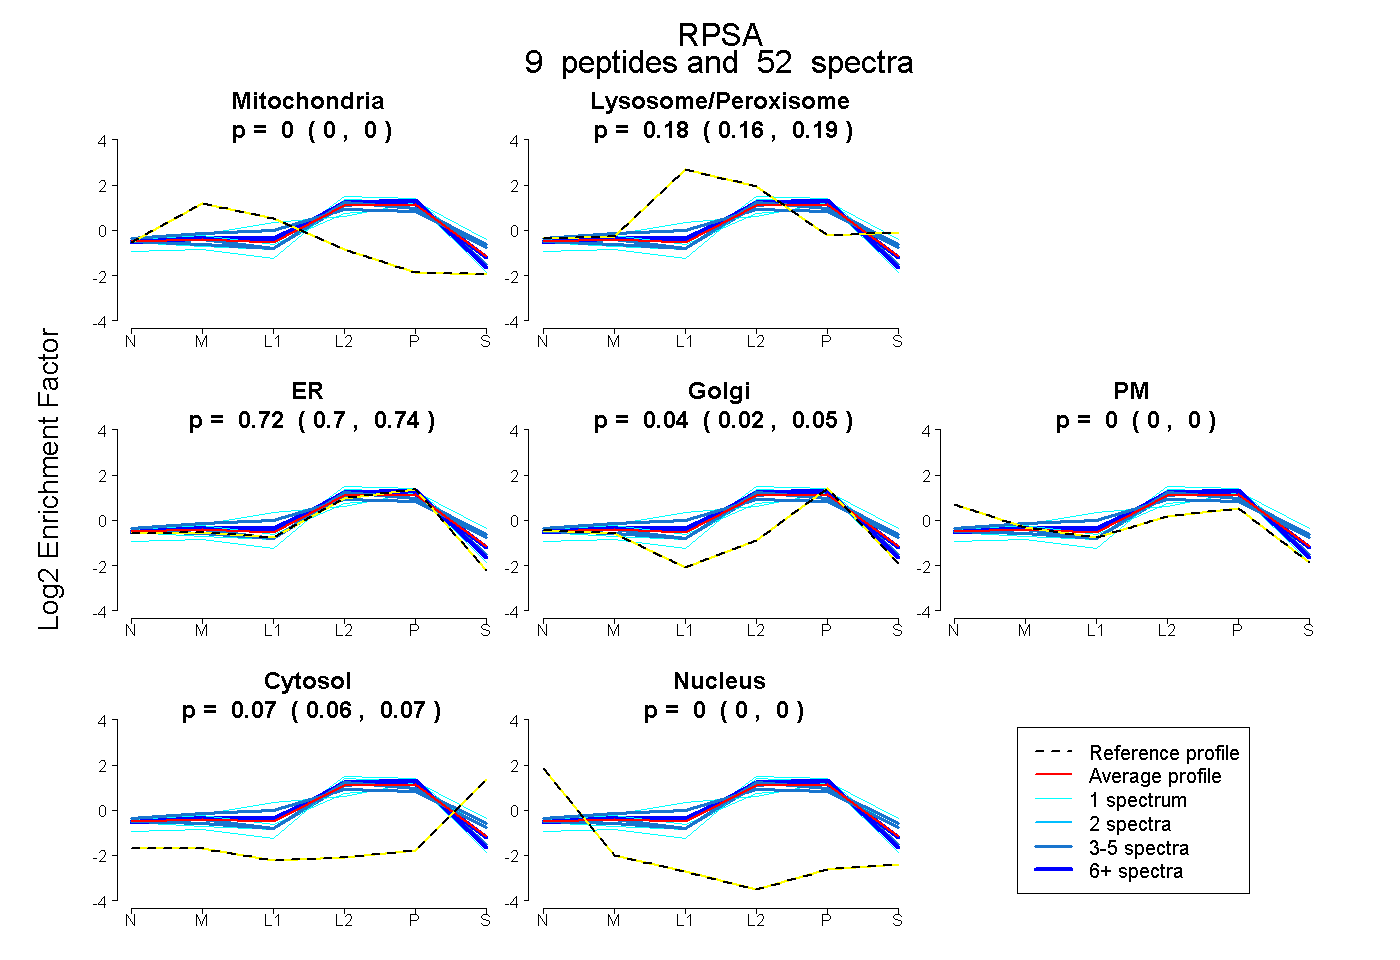 |
0.000 0.000 | 0.000 |
0.177 0.164 | 0.187 |
0.720 0.696 | 0.741 |
0.035 0.016 | 0.051 |
0.000 0.000 | 0.000 |
0.068 0.060 | 0.074 |
0.000 0.000 | 0.000 |
|||
| Plot | Lyso | Other | |||||||||||
| Expt C |
13 peptides |
156 spectra |
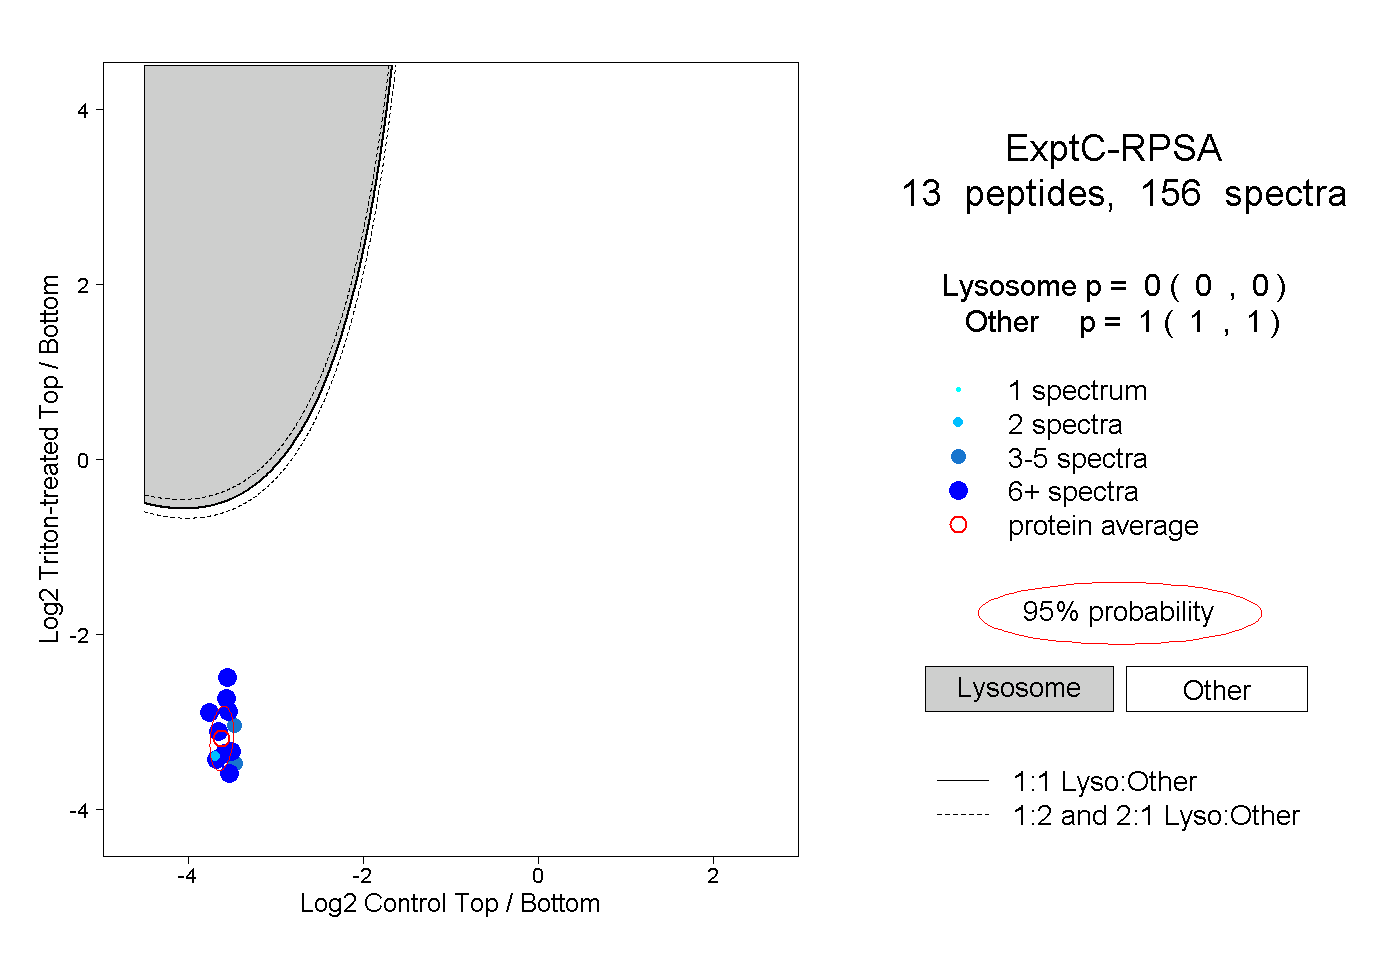 |
0.000 0.000 | 0.000 |
1.000 1.000 | 1.000 |
||||||||
| Plot | Lyso | Other | |||||||||||
| Expt D |
4 peptides |
18 spectra |
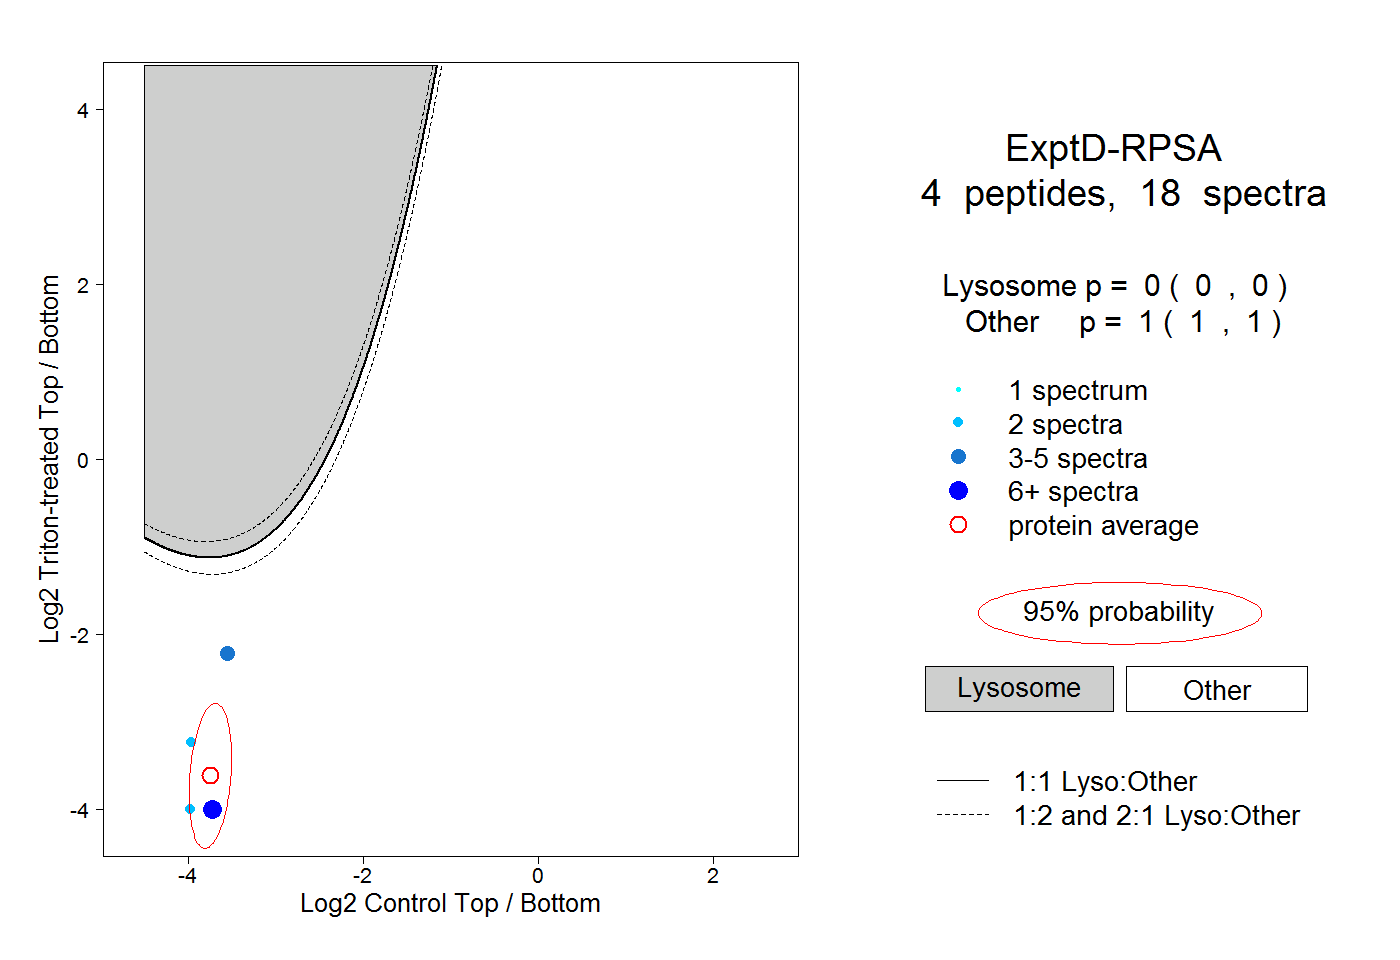 |
0.000 0.000 | 0.000 |
1.000 1.000 | 1.000 |