 36
36peptides
spectra
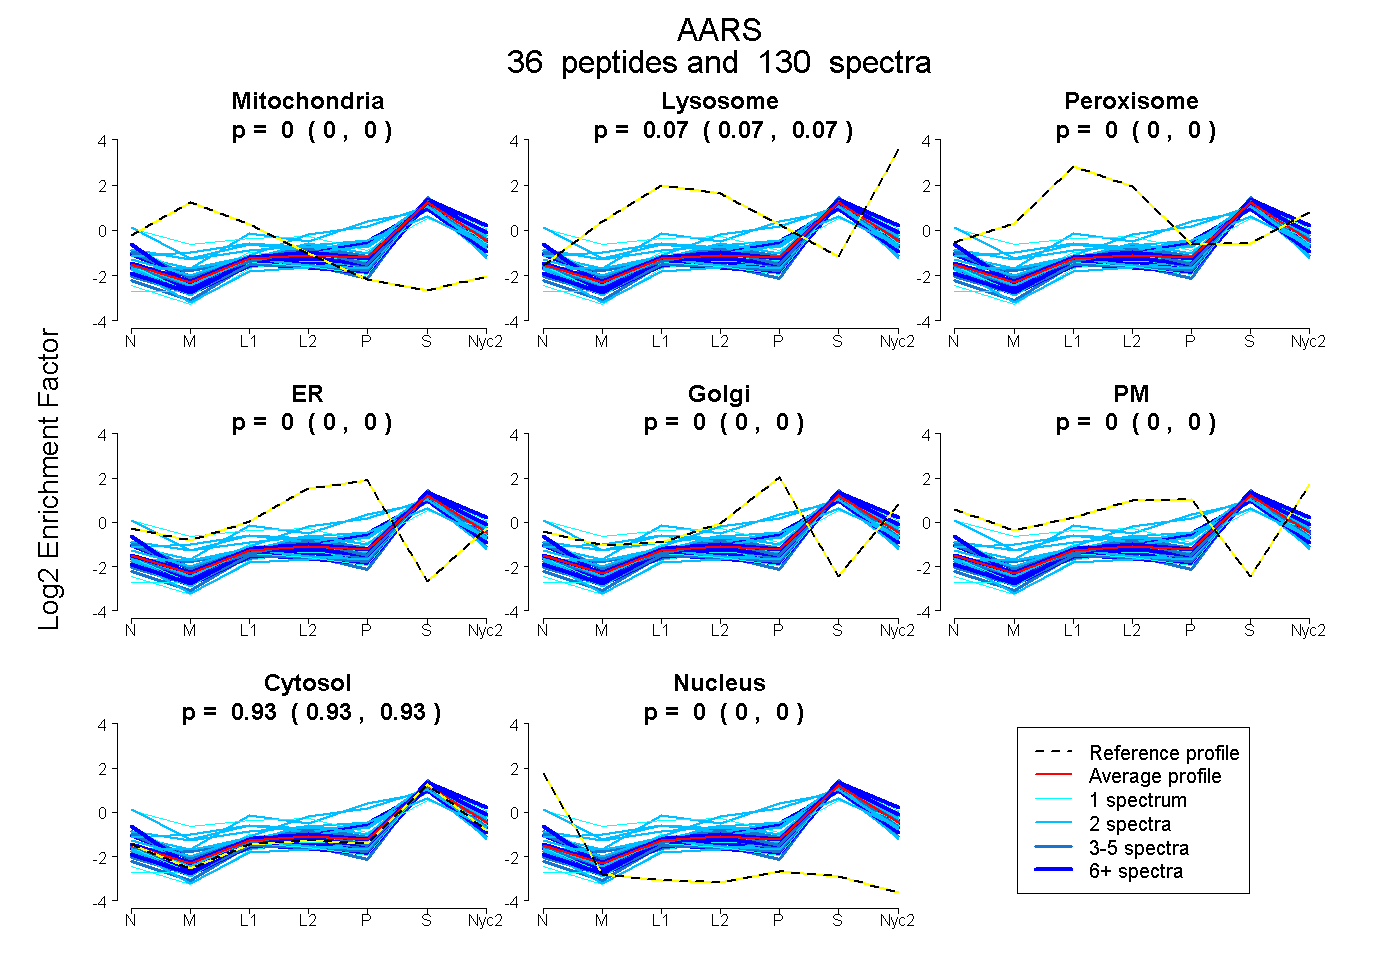
0.000 | 0.000
0.066 | 0.069
0.000 | 0.000
0.000 | 0.000
0.000 | 0.000
0.000 | 0.000
0.931 | 0.933
0.000 | 0.000
10peptides
spectra
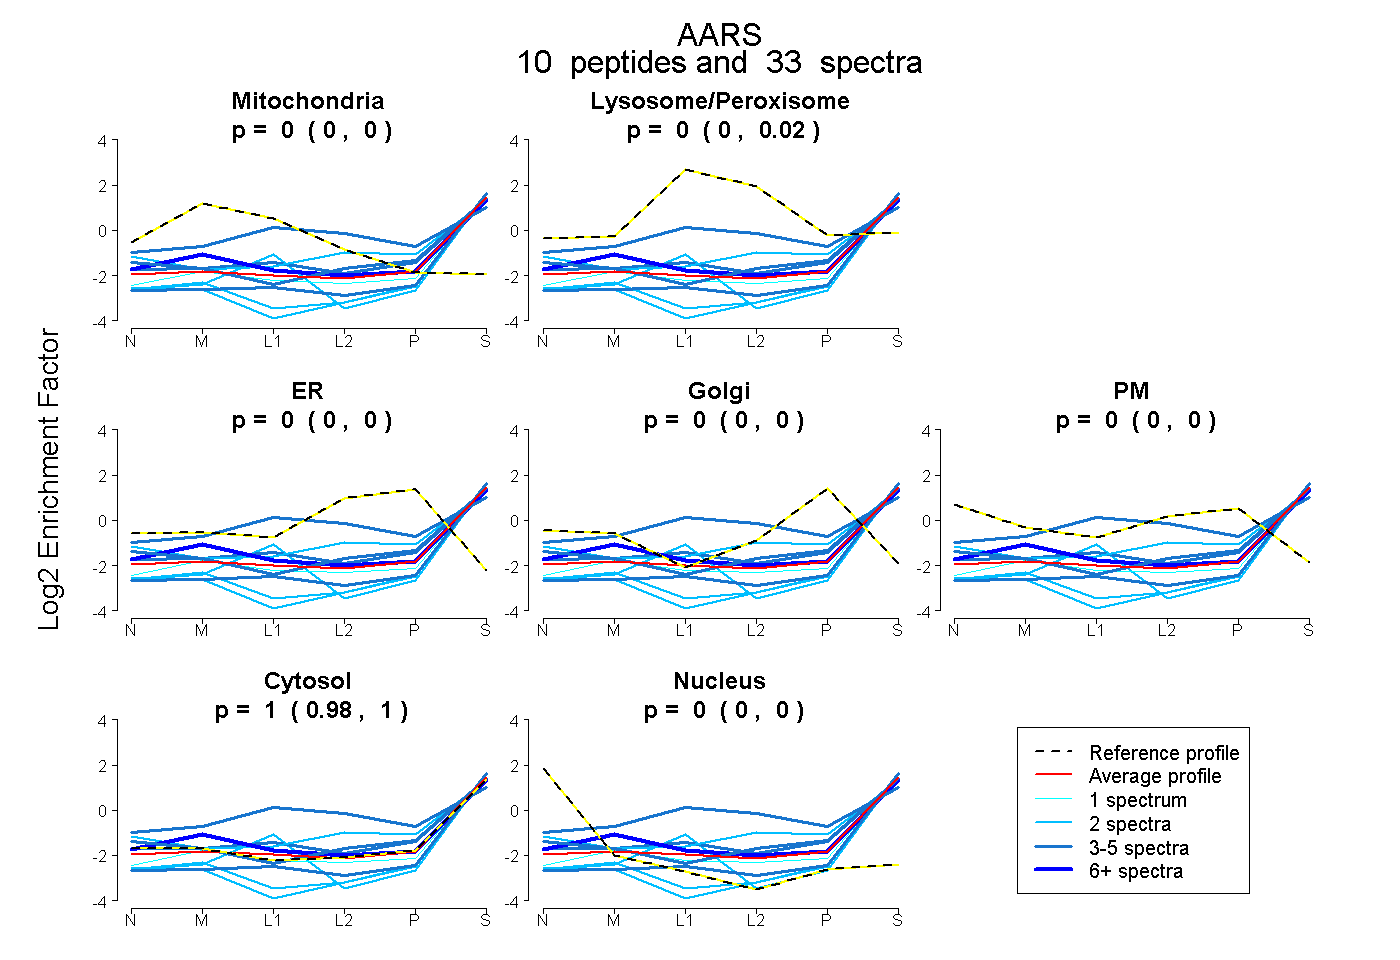
0.000 | 0.000
0.000 | 0.019
0.000 | 0.000
0.000 | 0.000
0.000 | 0.000
0.979 | 1.000
0.000 | 0.000
35peptides
spectra
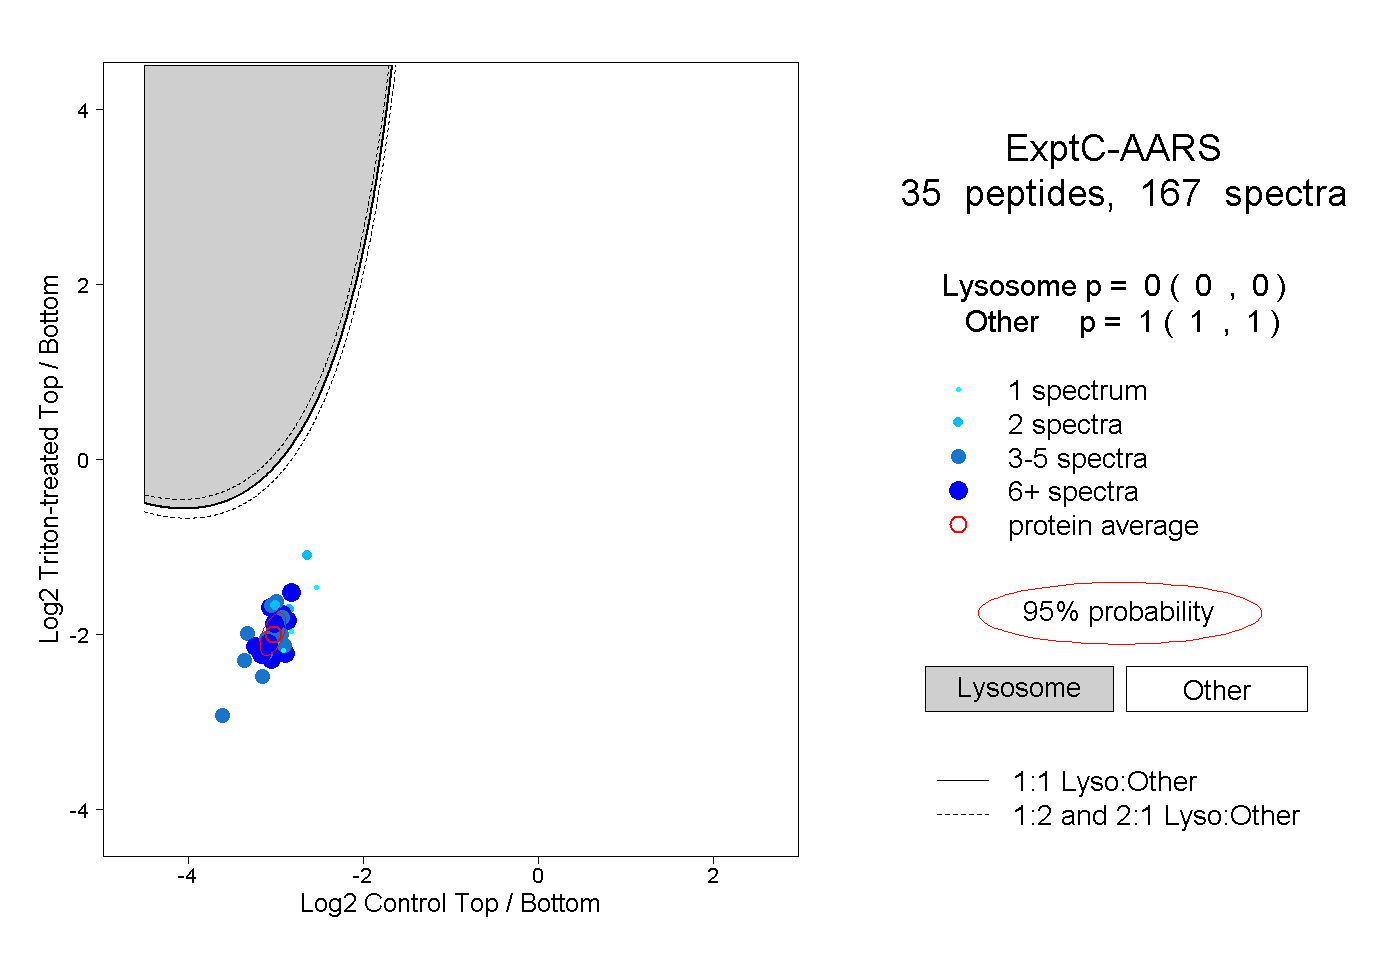
0.000 | 0.000
1.000 | 1.000
12peptides
spectra
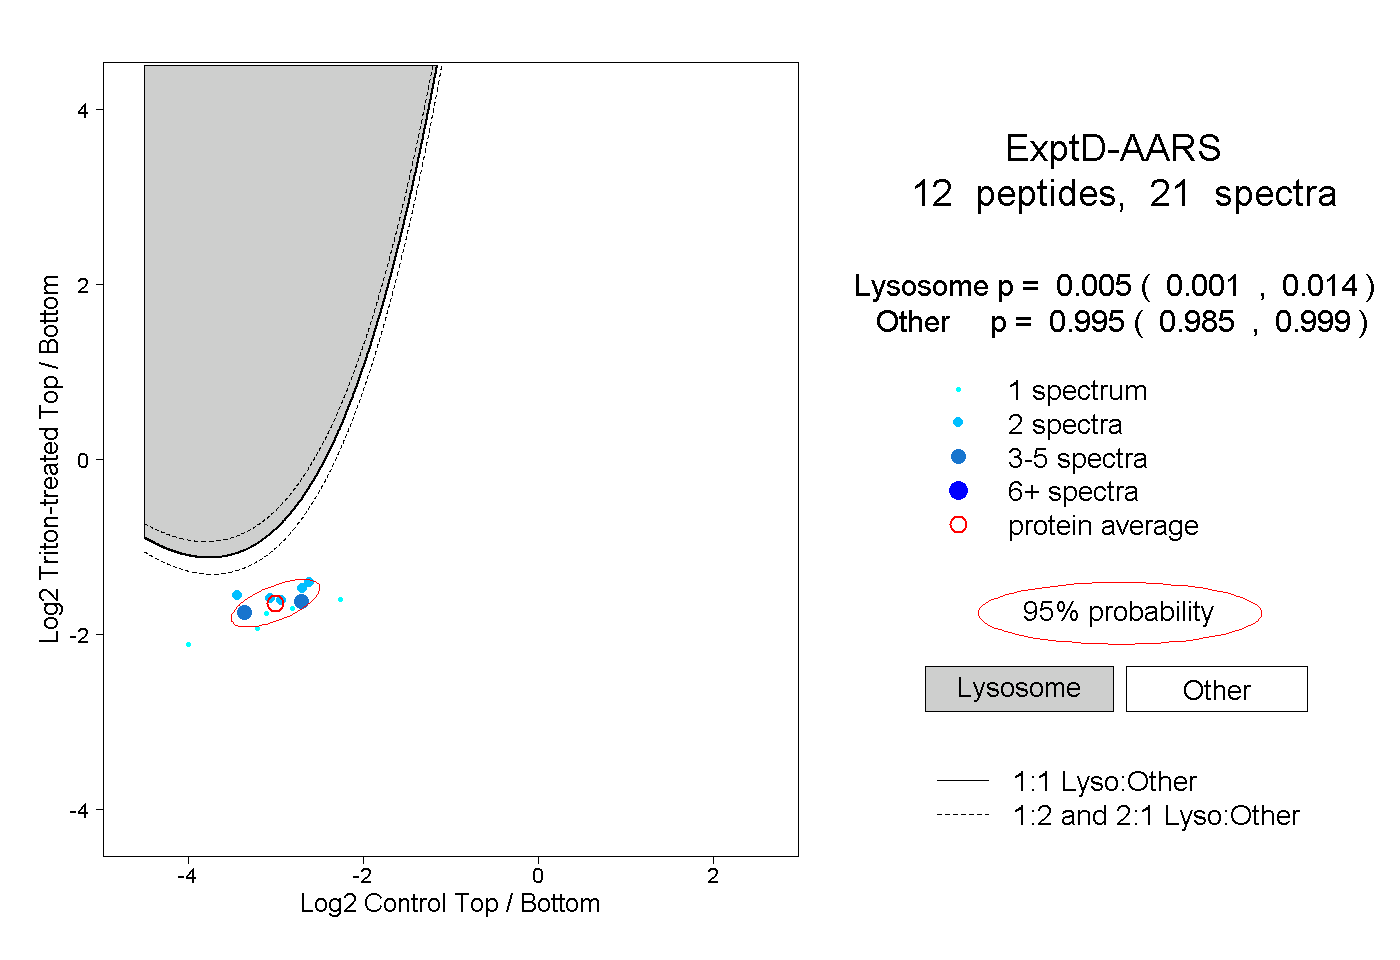
0.001 | 0.014
0.985 | 0.999