| 2 spectra, LFIDEPR |
0.000 |
|
0.000 |
|
0.000 |
0.000 |
0.000 |
1.000 |
0.000 |
|
| 5 spectra, VLADHAR |
0.000 |
|
0.000 |
|
0.037 |
0.035 |
0.007 |
0.921 |
0.000 |
|
| 6 spectra, TITVALADGGRPDNTGR |
0.098 |
|
0.010 |
|
0.000 |
0.000 |
0.000 |
0.892 |
0.000 |
|
| 2 spectra, ALQGLR |
0.000 |
|
0.000 |
|
0.000 |
0.000 |
0.000 |
1.000 |
0.000 |
|
| 2 spectra, SIDTGMGLER |
0.000 |
|
0.150 |
|
0.067 |
0.000 |
0.000 |
0.783 |
0.000 |
|
| 4 spectra, VGAEDTDGIDMAYR |
0.000 |
|
0.490 |
|
0.000 |
0.003 |
0.000 |
0.507 |
0.000 |
|
| 5 spectra, GGYVLHIGTIYGNLR |
0.000 |
|
0.106 |
|
0.000 |
0.000 |
0.000 |
0.894 |
0.000 |
|
| 4 spectra, VMDDLDR |
0.000 |
|
0.000 |
|
0.000 |
0.000 |
0.000 |
1.000 |
0.000 |
|
| 1 spectrum, MFVDEVVTGQECGVVLDK |
0.000 |
|
0.000 |
|
0.000 |
0.000 |
0.000 |
1.000 |
0.000 |
|
| 2 spectra, GSLVAPDR |
0.000 |
|
0.000 |
|
0.000 |
0.000 |
0.000 |
1.000 |
0.000 |
|
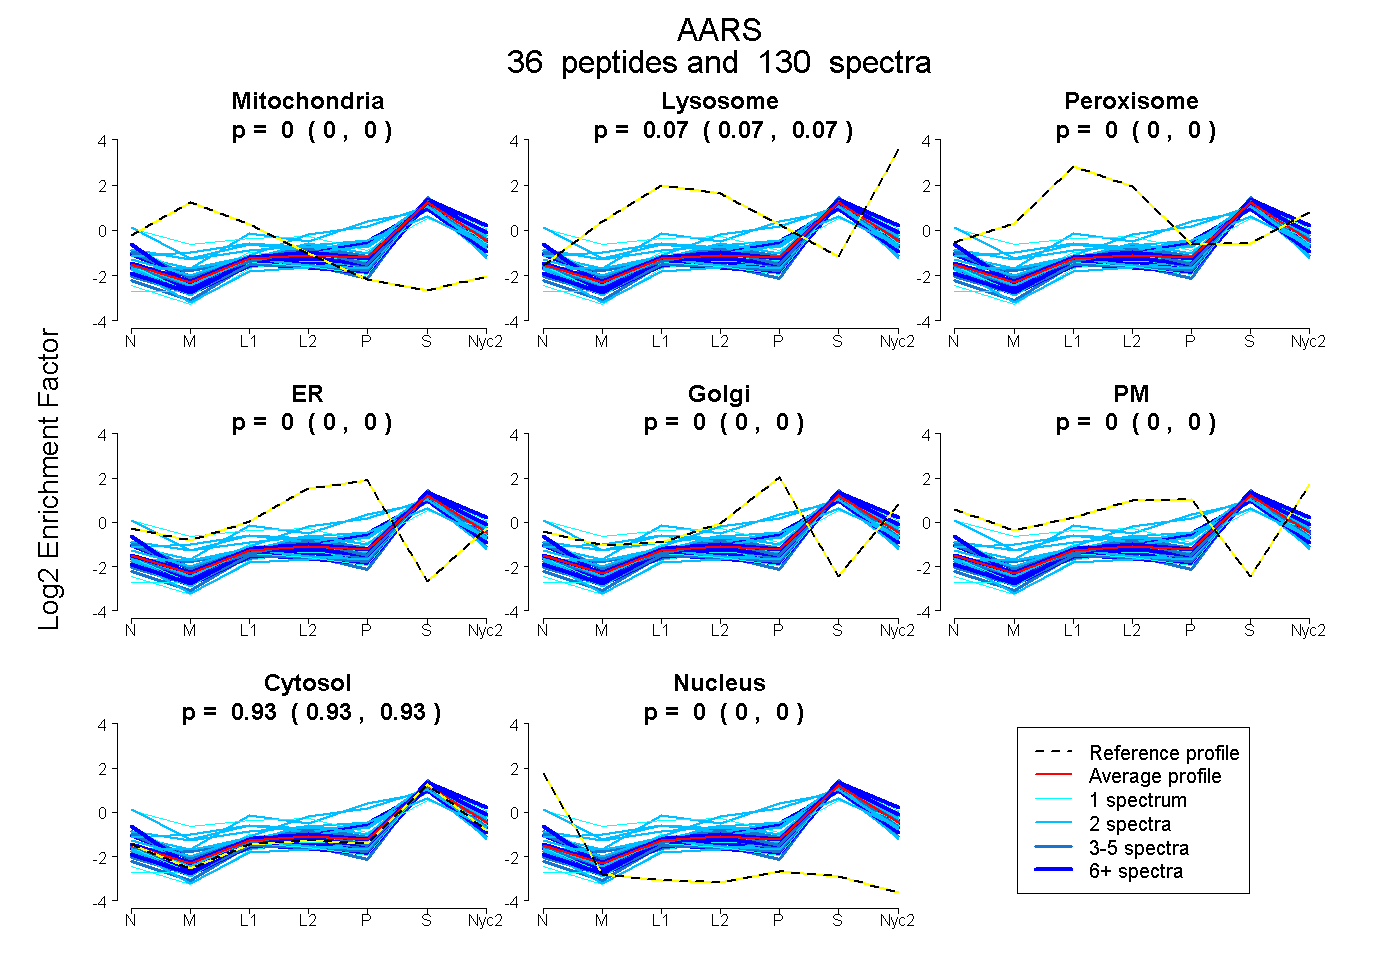
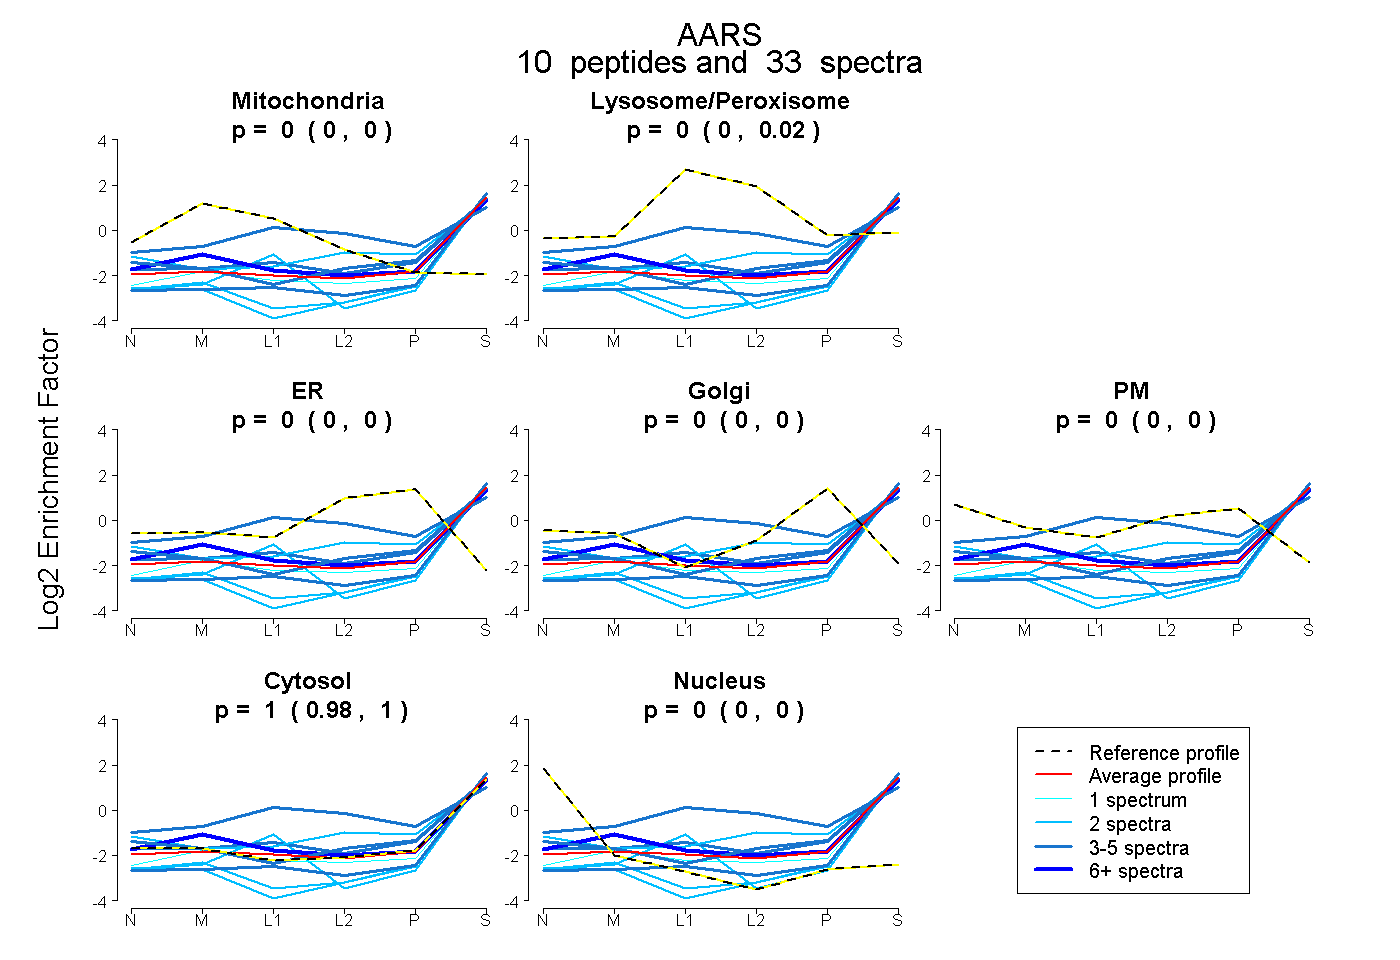
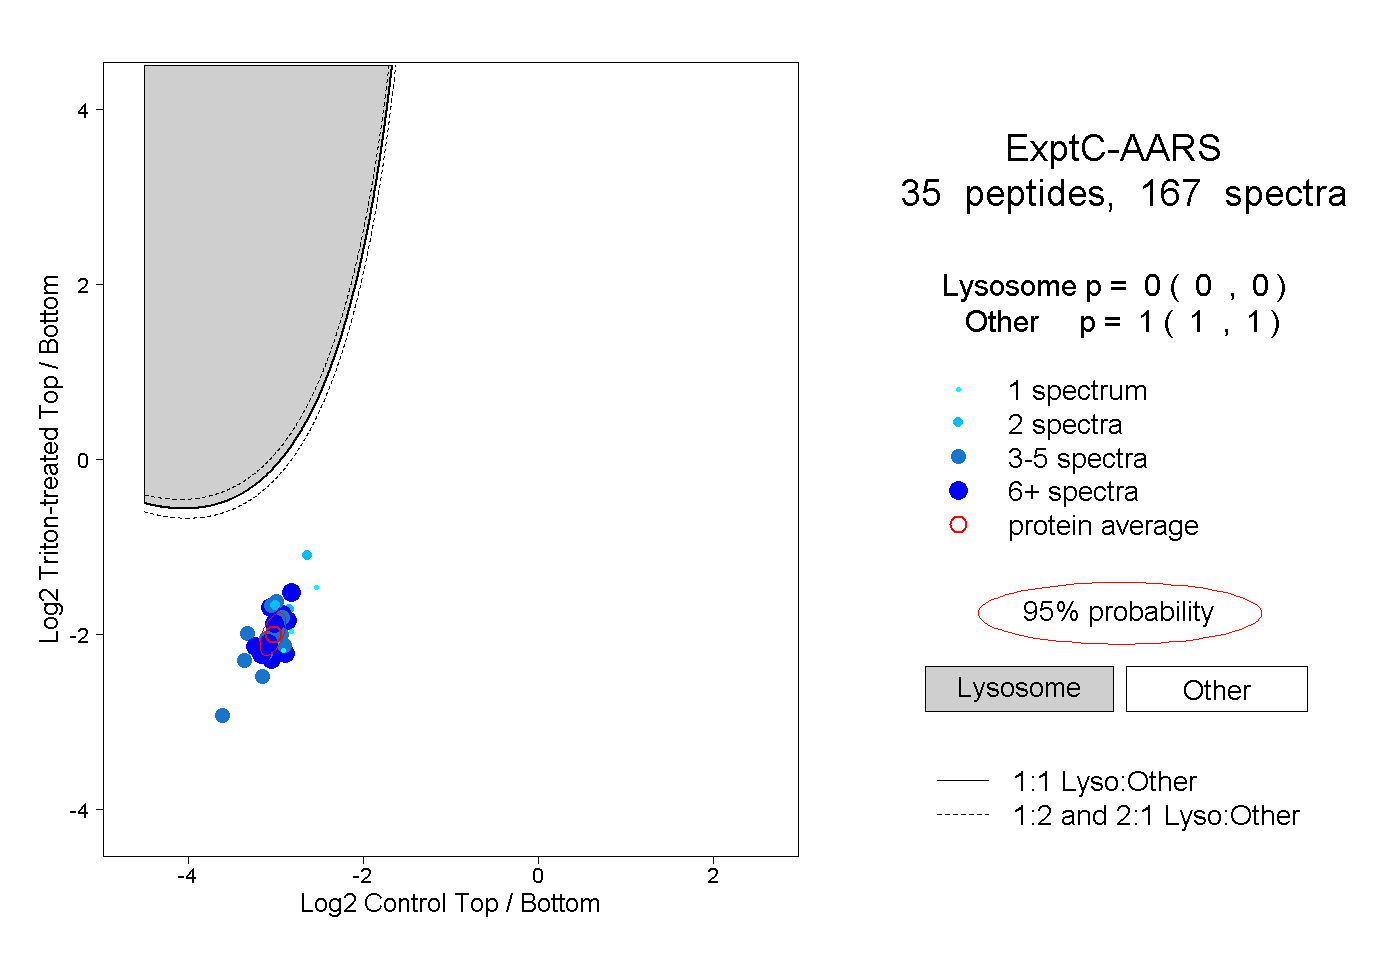
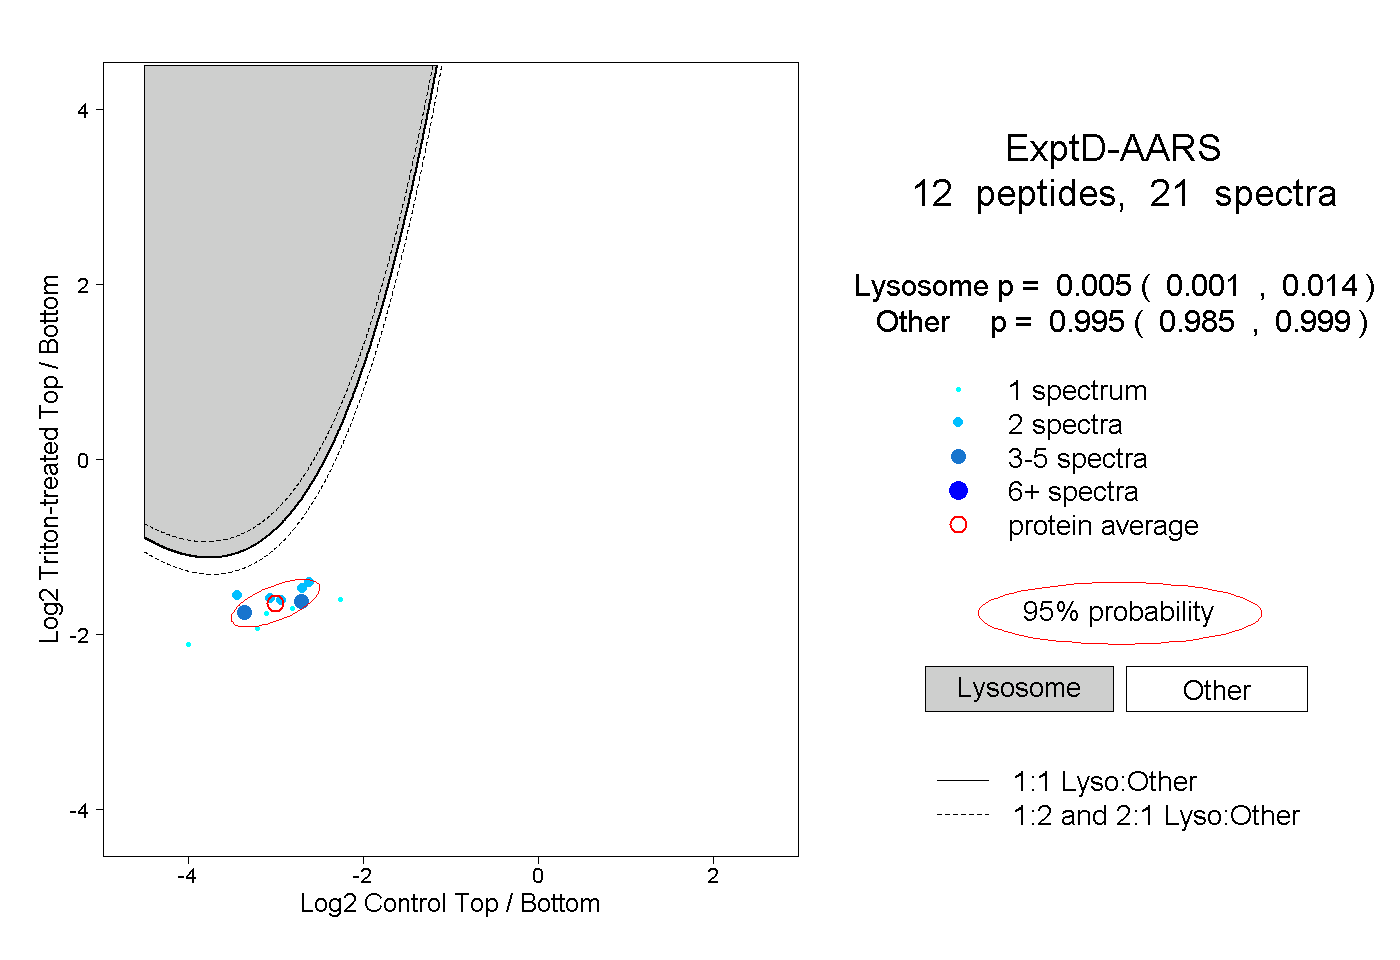
 36
36