 10
10peptides
spectra
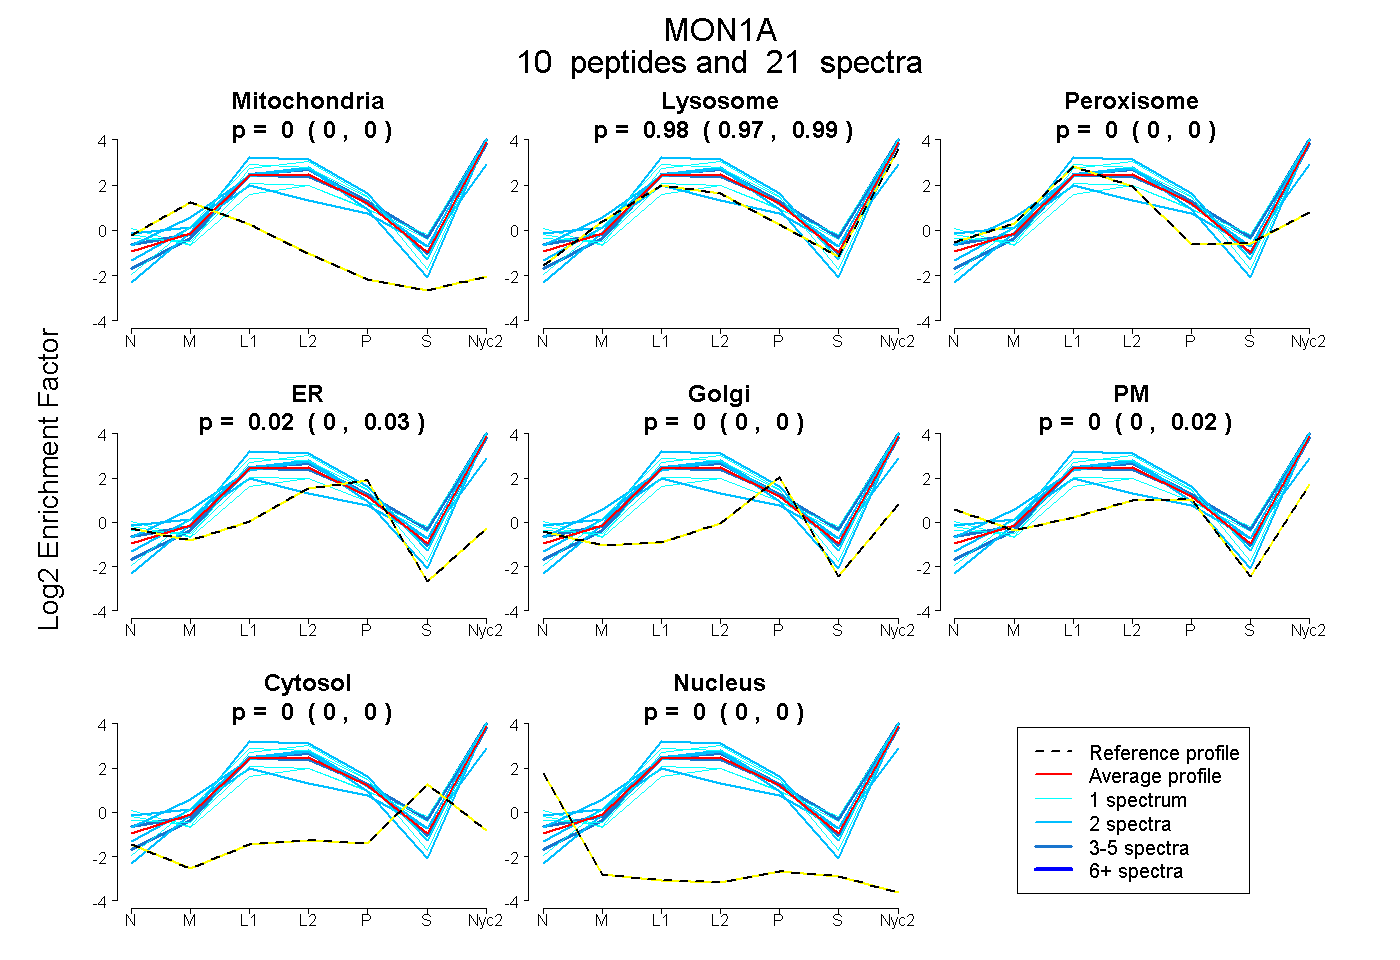
0.000 | 0.000
0.966 | 0.991
0.000 | 0.000
0.004 | 0.027
0.000 | 0.000
0.000 | 0.016
0.000 | 0.000
0.000 | 0.000
5peptides
spectra
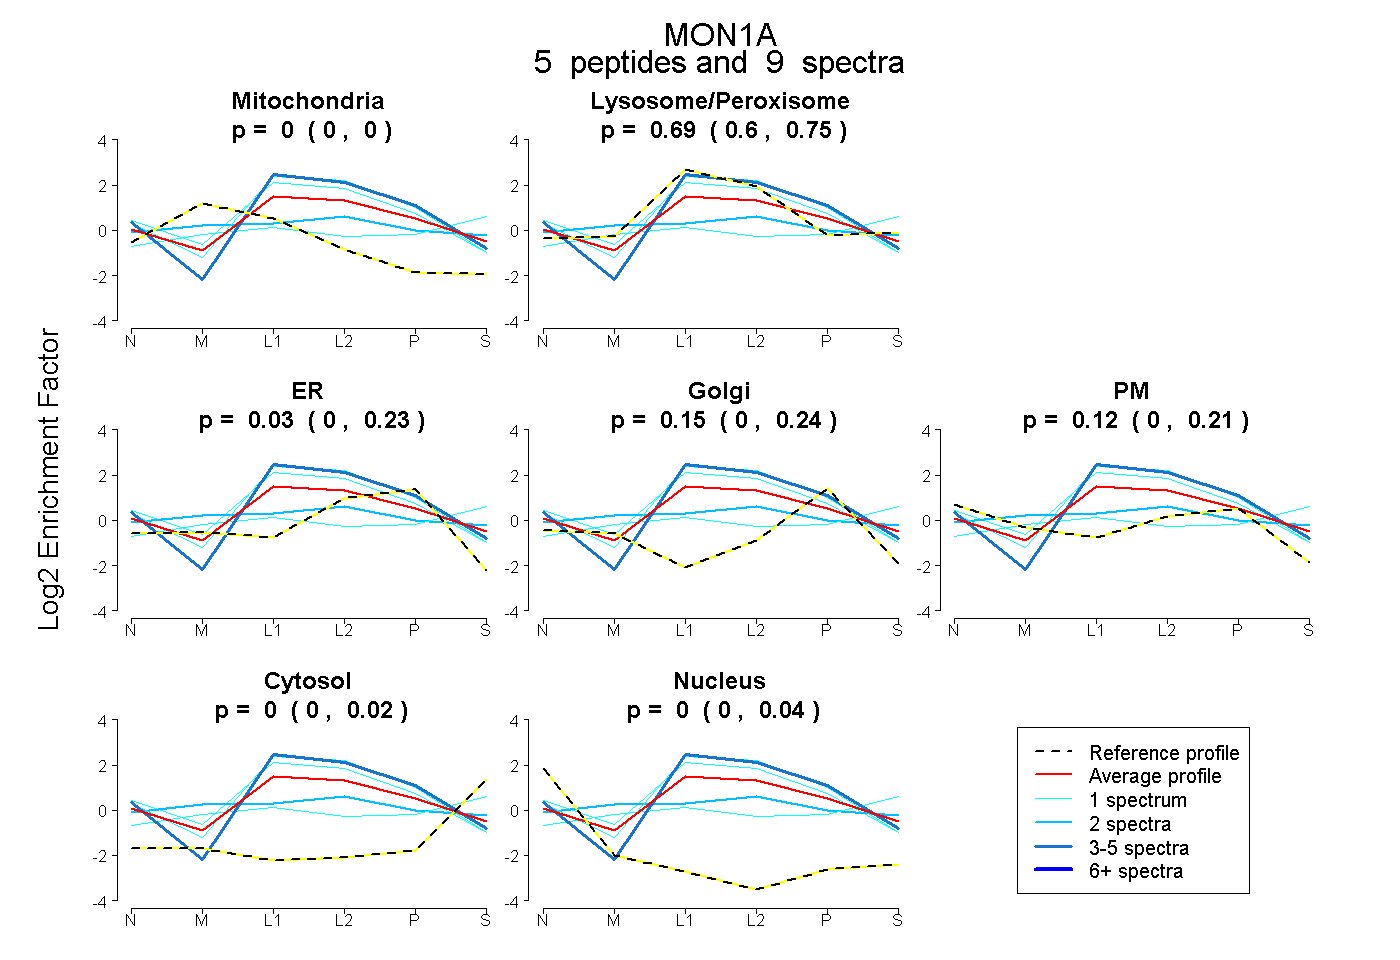
0.000 | 0.000
0.603 | 0.746
0.000 | 0.229
0.000 | 0.242
0.000 | 0.213
0.000 | 0.024
0.000 | 0.039
17peptides
spectra
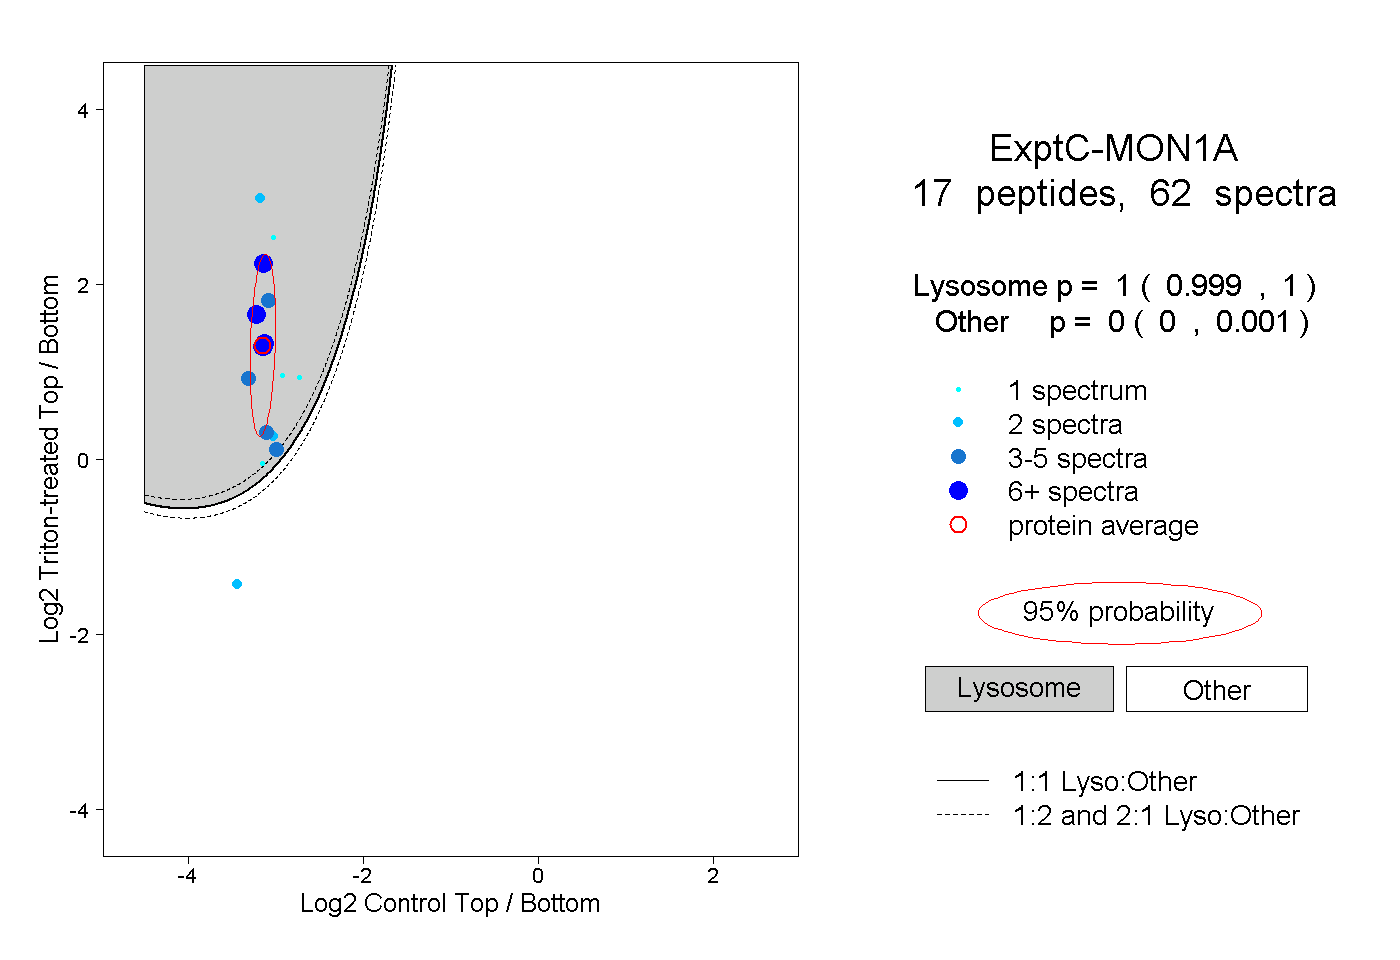
0.999 | 1.000
0.000 | 0.001
7peptides
spectra
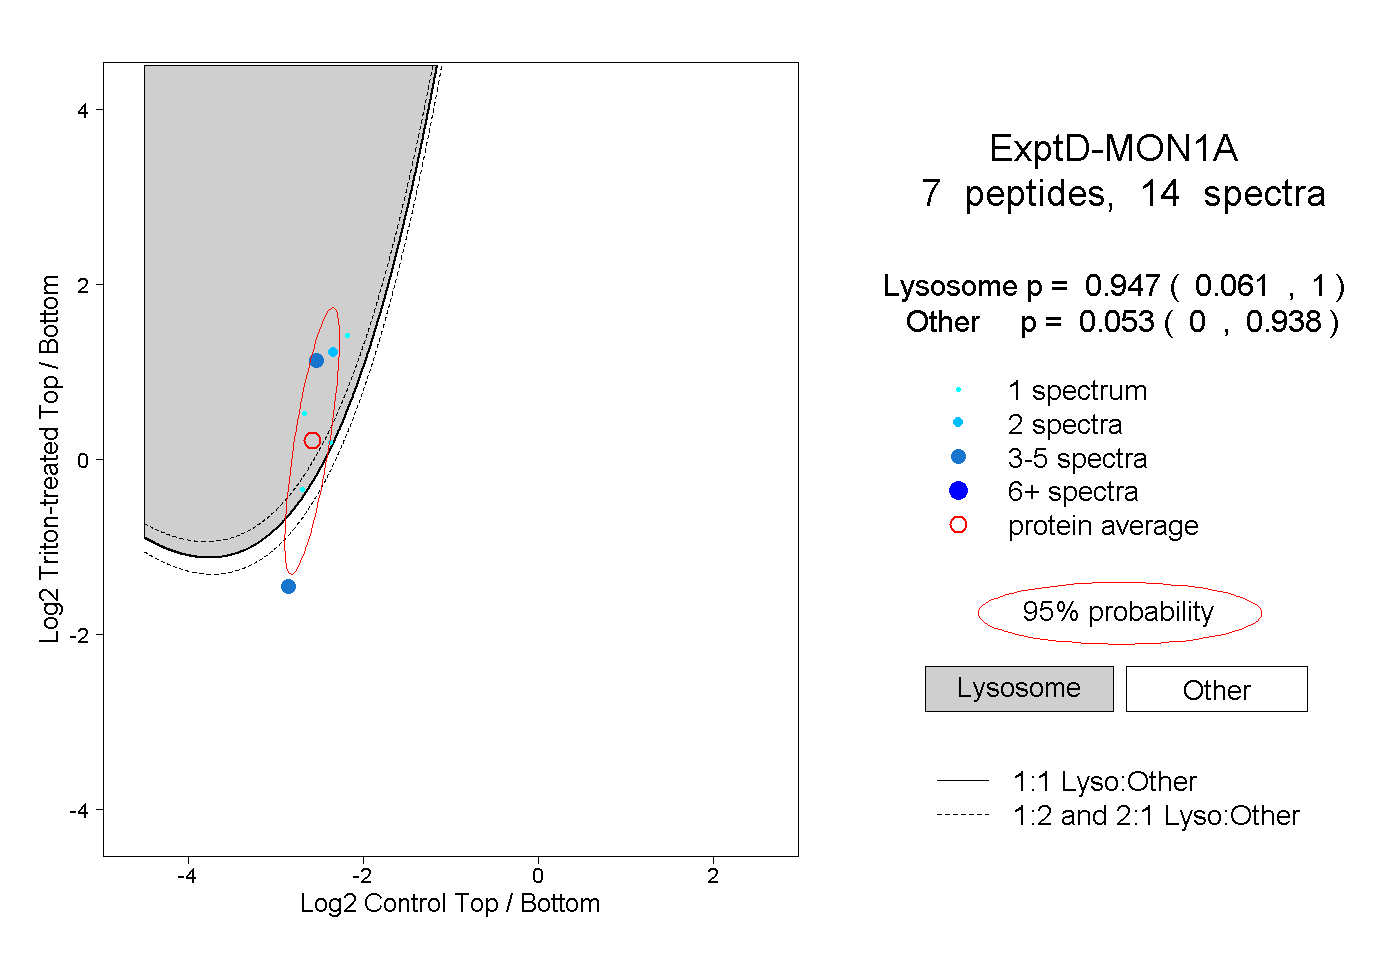
0.061 | 1.000
0.000 | 0.938