 10
10peptides
spectra
0.000 | 0.000
0.966 | 0.991
0.000 | 0.000
0.004 | 0.027
0.000 | 0.000
0.000 | 0.016
0.000 | 0.000
0.000 | 0.000
| Plot | Mito | Lyso | Perox | ER | Golgi | PM | Cytosol | Nucleus | |||||
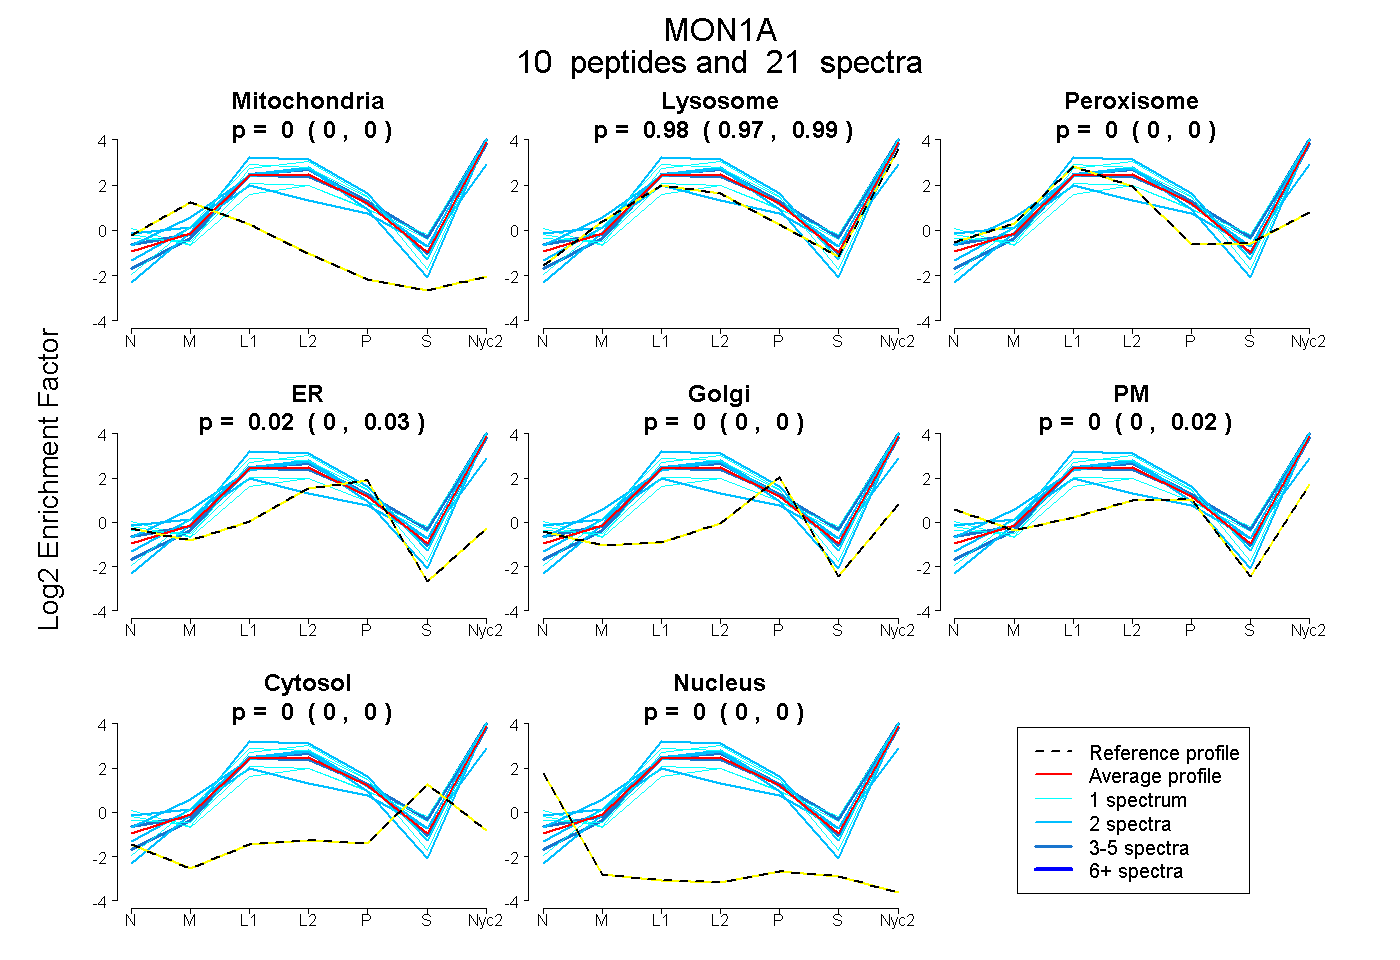
| Expt A |
10 peptides |
21 spectra |
|
0.000 0.000 | 0.000 |
0.982 0.966 | 0.991 |
0.000 0.000 | 0.000 |
0.018 0.004 | 0.027 |
0.000 0.000 | 0.000 |
0.000 0.000 | 0.016 |
0.000 0.000 | 0.000 |
0.000 0.000 | 0.000 |
| 2 spectra, EYVGSPPPLPTDIR | 0.000 | 0.569 | 0.176 | 0.000 | 0.000 | 0.255 | 0.000 | 0.000 | ||
| 2 spectra, LLSGSER | 0.000 | 1.000 | 0.000 | 0.000 | 0.000 | 0.000 | 0.000 | 0.000 | ||
| 1 spectrum, AHNASRPLK | 0.000 | 0.763 | 0.000 | 0.000 | 0.000 | 0.237 | 0.000 | 0.000 | ||
| 1 spectrum, ITDNLLQLMAR | 0.000 | 0.833 | 0.000 | 0.000 | 0.000 | 0.167 | 0.000 | 0.000 | ||
| 1 spectrum, SPLVLVAVAR | 0.000 | 1.000 | 0.000 | 0.000 | 0.000 | 0.000 | 0.000 | 0.000 | ||
| 5 spectra, DPSFLMGAAR | 0.000 | 1.000 | 0.000 | 0.000 | 0.000 | 0.000 | 0.000 | 0.000 | ||
| 2 spectra, NQLVALVR | 0.000 | 0.915 | 0.000 | 0.000 | 0.000 | 0.085 | 0.000 | 0.000 | ||
| 1 spectrum, HVFVLSEAGKPVYSR | 0.000 | 0.915 | 0.000 | 0.000 | 0.000 | 0.085 | 0.000 | 0.000 | ||
| 2 spectra, DTVSASLQQAR | 0.000 | 1.000 | 0.000 | 0.000 | 0.000 | 0.000 | 0.000 | 0.000 | ||
| 4 spectra, CLPLAAAVR | 0.000 | 0.937 | 0.000 | 0.016 | 0.000 | 0.047 | 0.000 | 0.000 |
| Plot | Mito | Lyso or Perox | ER | Golgi | PM | Cytosol | Nucleus | ||||||
| Expt B |
5 peptides |
9 spectra |
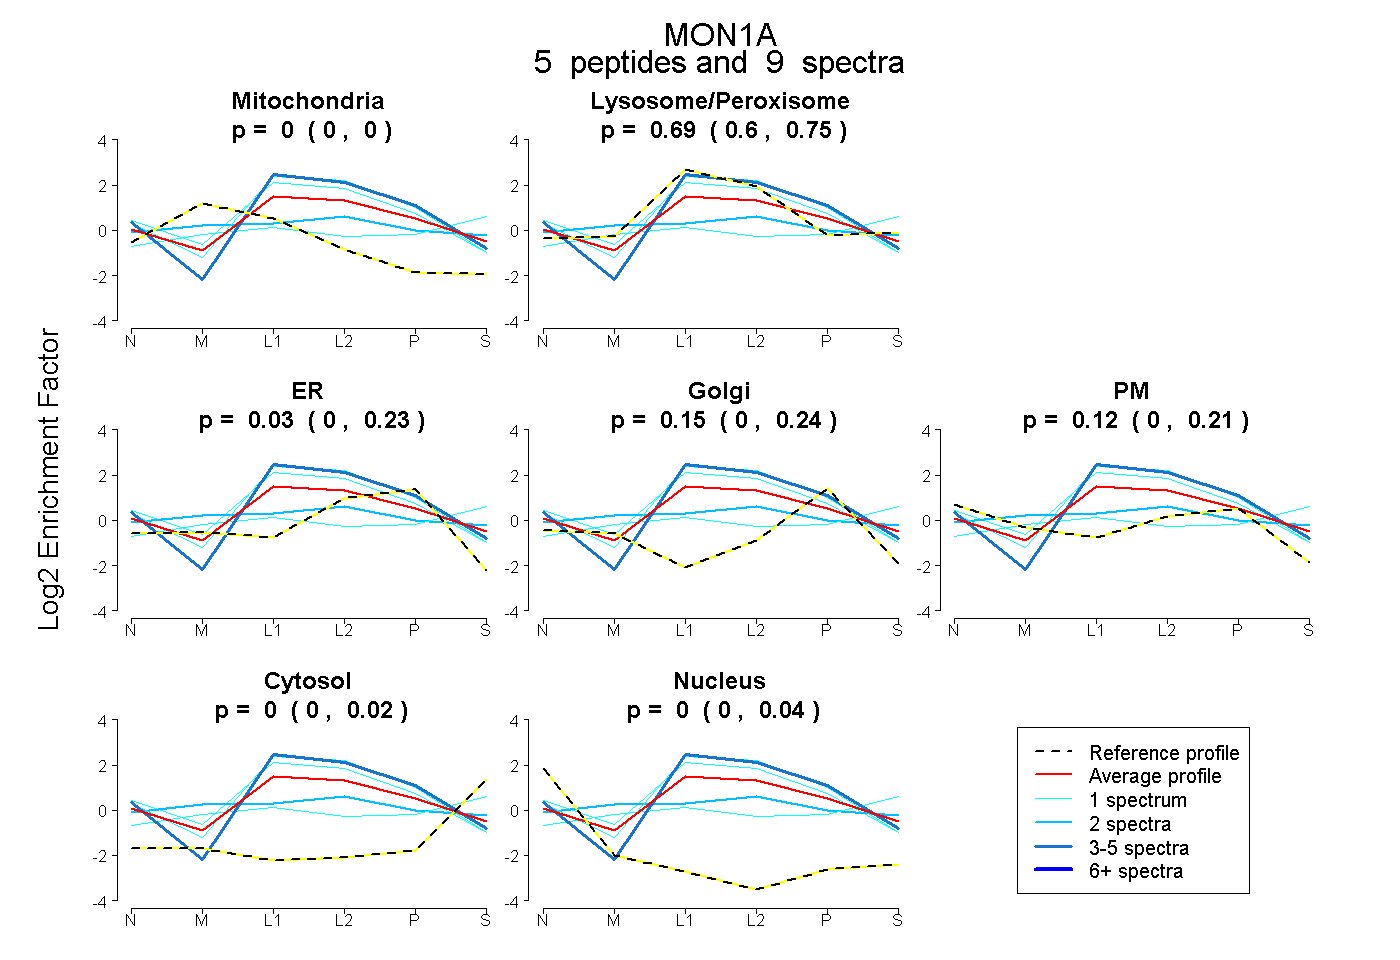 |
0.000 0.000 | 0.000 |
0.692 0.603 | 0.746 |
0.034 0.000 | 0.229 |
0.155 0.000 | 0.242 |
0.119 0.000 | 0.213 |
0.000 0.000 | 0.024 |
0.000 0.000 | 0.039 |
|||
| Plot | Lyso | Other | |||||||||||
| Expt C |
17 peptides |
62 spectra |
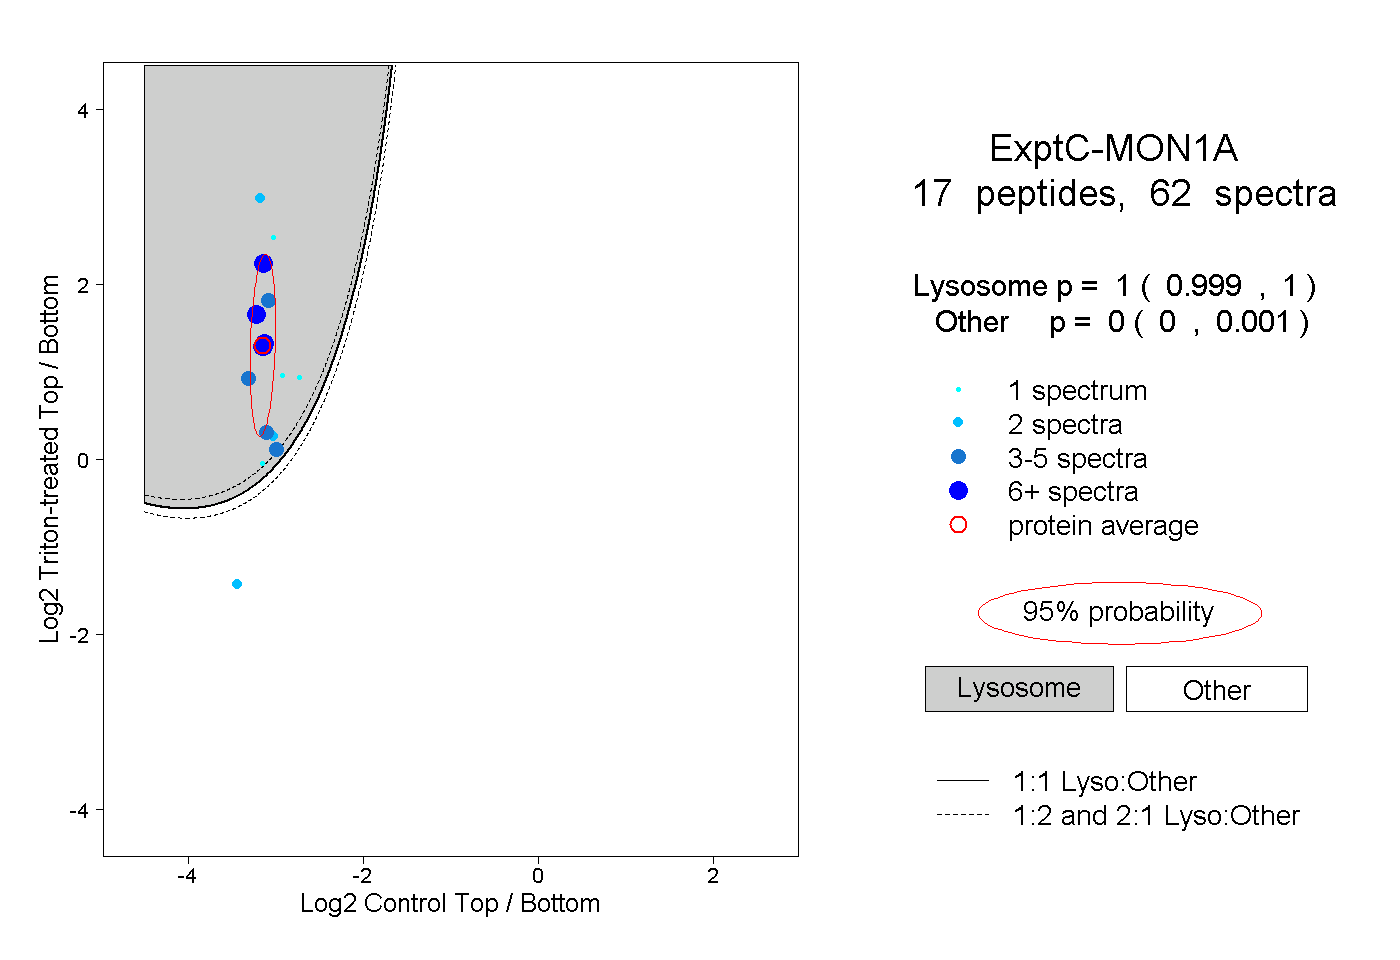 |
1.000 0.999 | 1.000 |
0.000 0.000 | 0.001 |
||||||||
| Plot | Lyso | Other | |||||||||||
| Expt D |
7 peptides |
14 spectra |
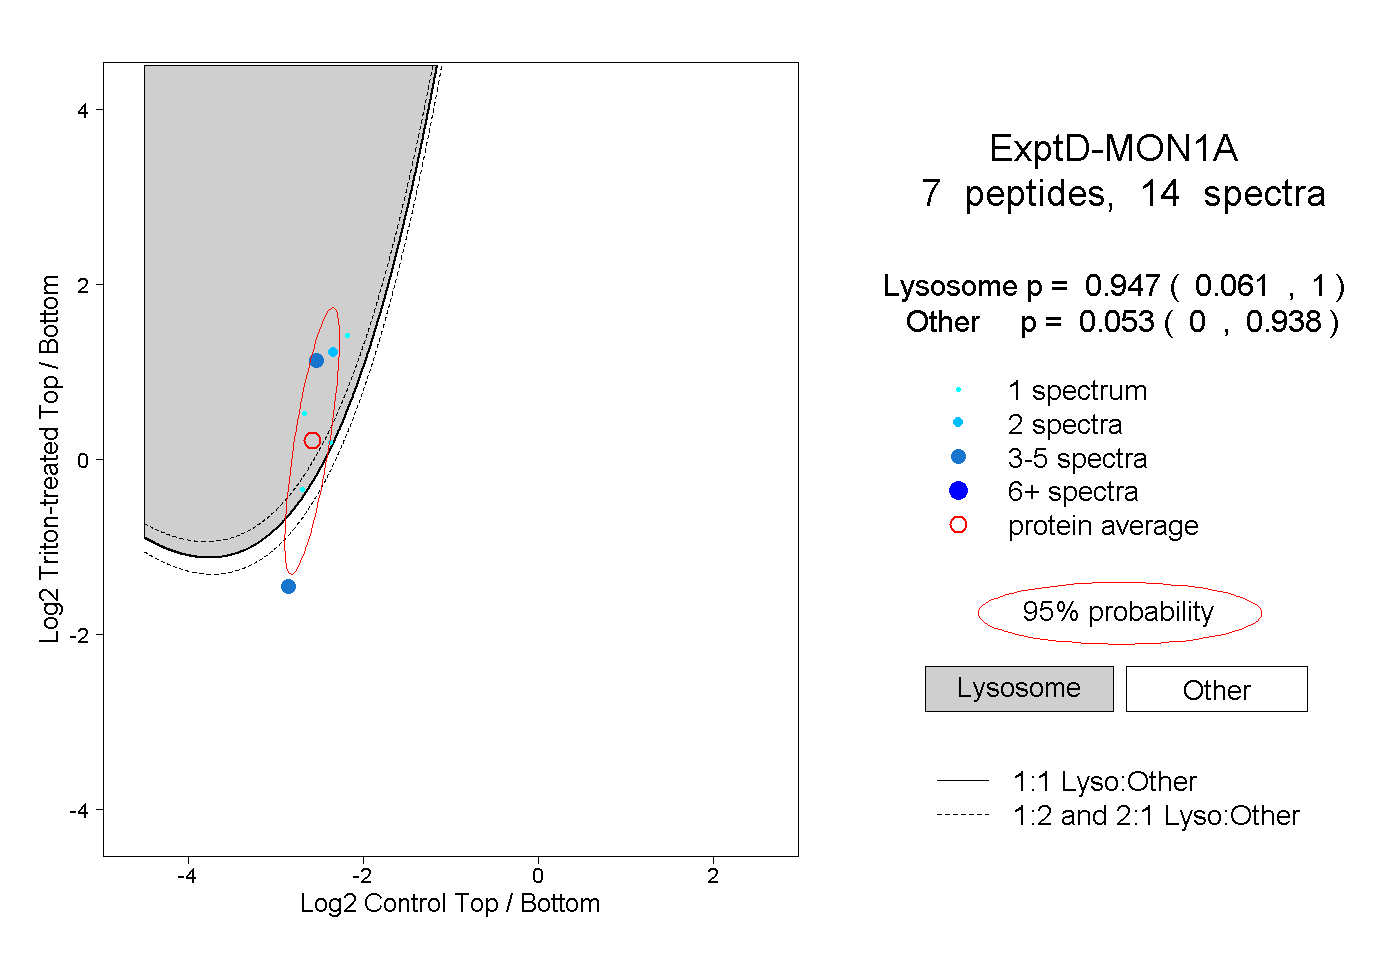 |
0.947 0.061 | 1.000 |
0.053 0.000 | 0.938 |